

- Moving the markets
The new year started with a sour note for stocks, as they continued their downward slide from the end of 2023.
Rising interest rates and profit-taking after a stellar 2023 weighed on the market, especially the Nasdaq, which suffered its worst drop in more than two months. Apple was among the biggest losers, as Barclays cut its rating on the tech giant to underweight, citing slowing growth and rising competition.
The Dow fared better, thanks to some defensive stocks like Johnson & Johnson and Merck that held up well.
The market had a strong rally in 2023, as the economy proved resilient and inflation eased, while the Fed signaled a pause in rate hikes and hinted at possible rate cuts later this year. But don’t hold your breath for that, as the economic outlook is still uncertain.
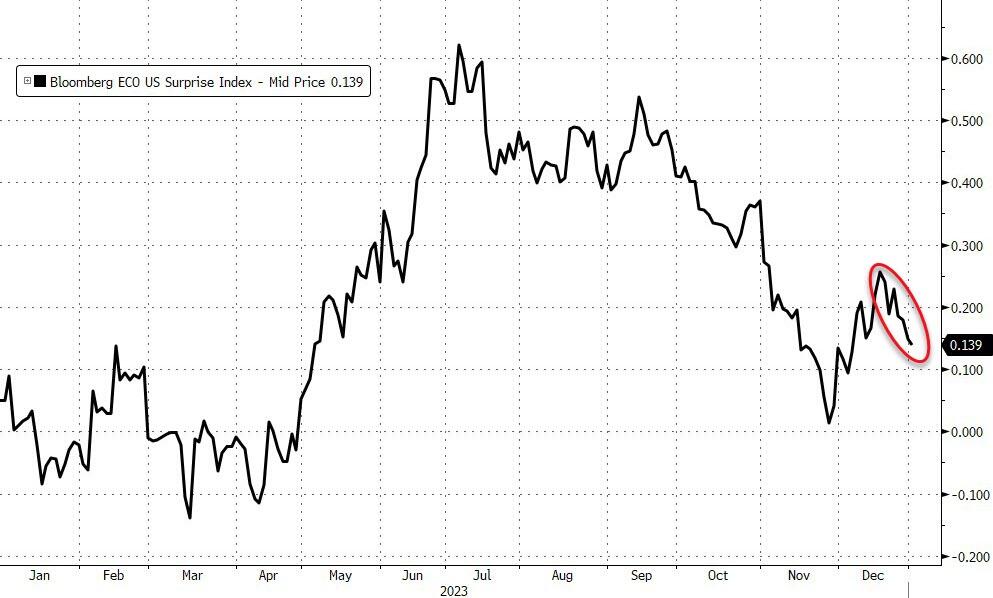
The latest data showed that US manufacturing activity contracted in December, with orders falling and prices rising, while construction spending also missed expectations. These signs of weakness were reflected in the Economic Surprise Index, which measures how the data compares to forecasts.
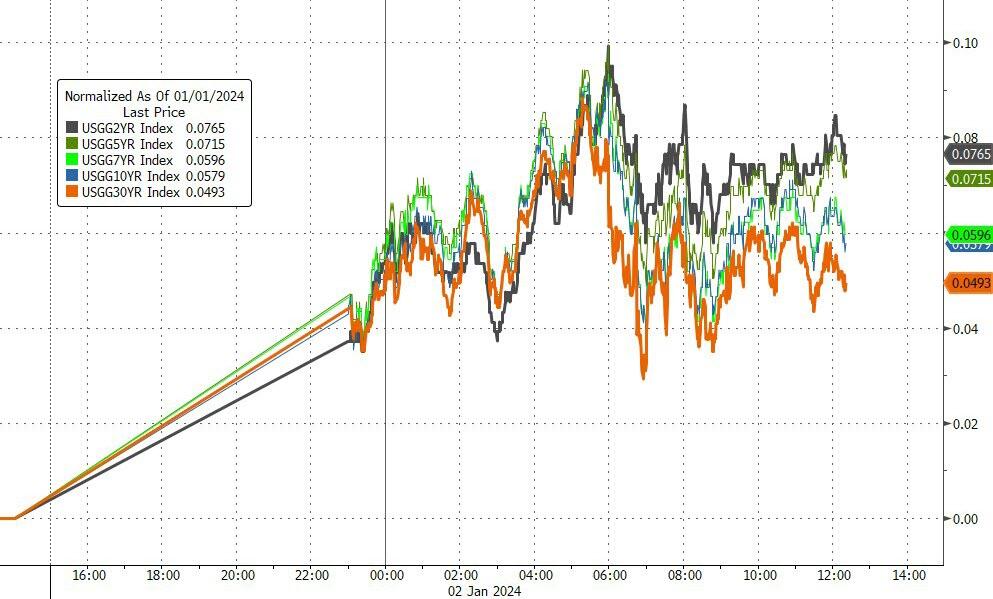
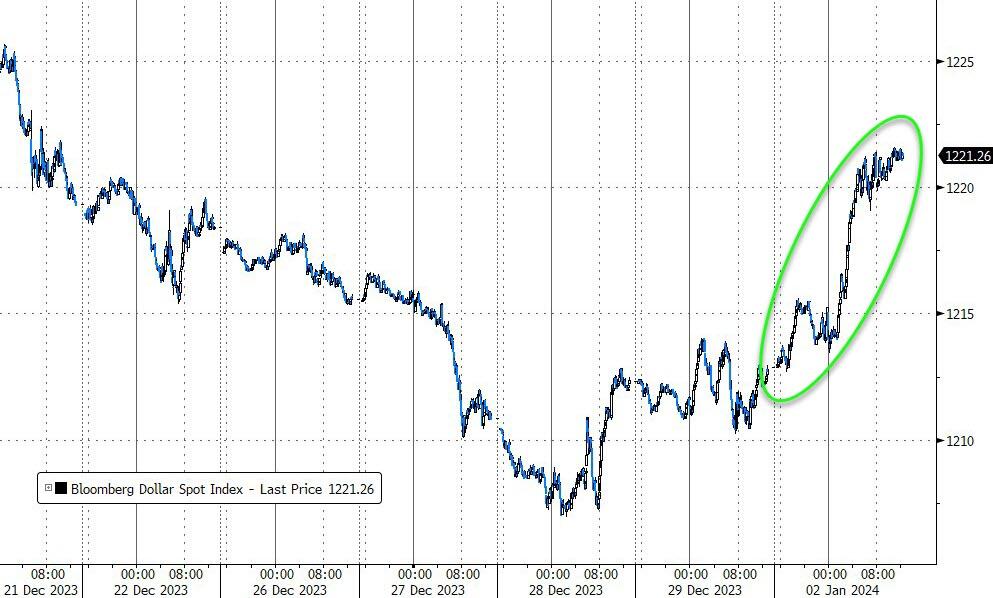
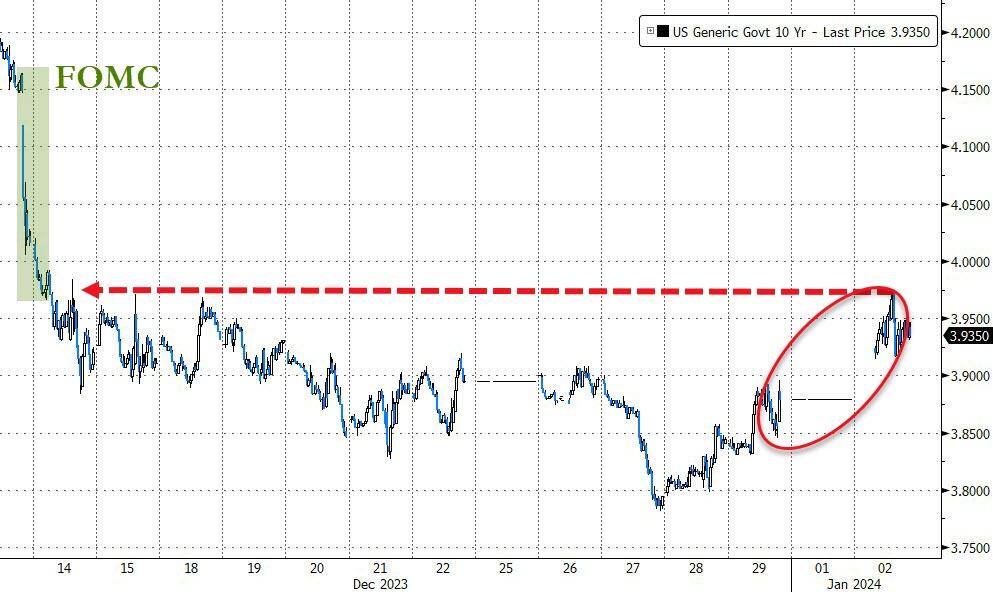
You would think that weak data would push bond yields lower, but the opposite happened. Yields jumped and the dollar strengthened, as the 10-year Treasury yield broke above 3-week highs.
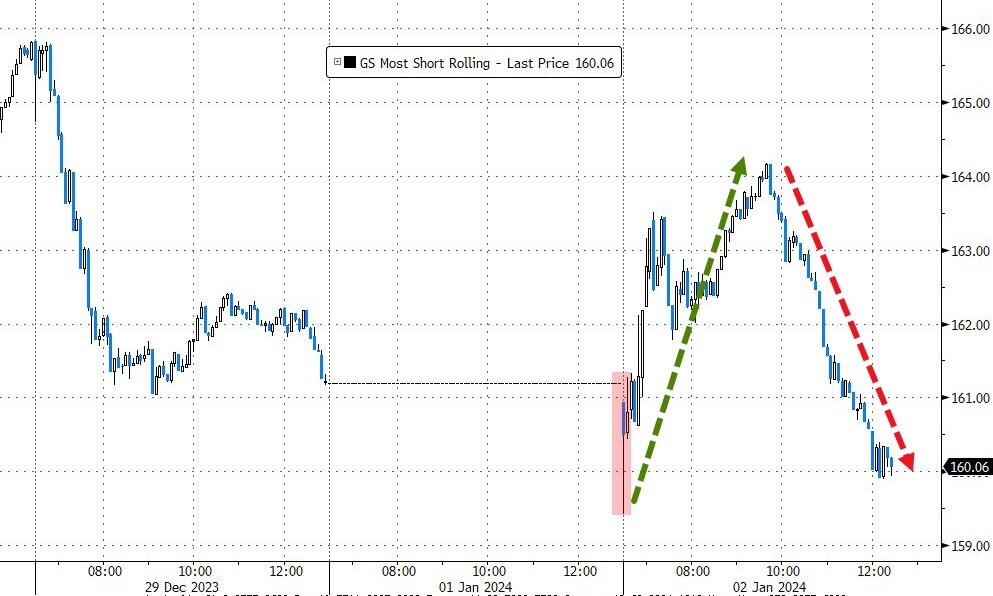
The most shorted stocks had a wild ride, as they plunged, soared, and plunged again, all in one day. Who can make sense of that?
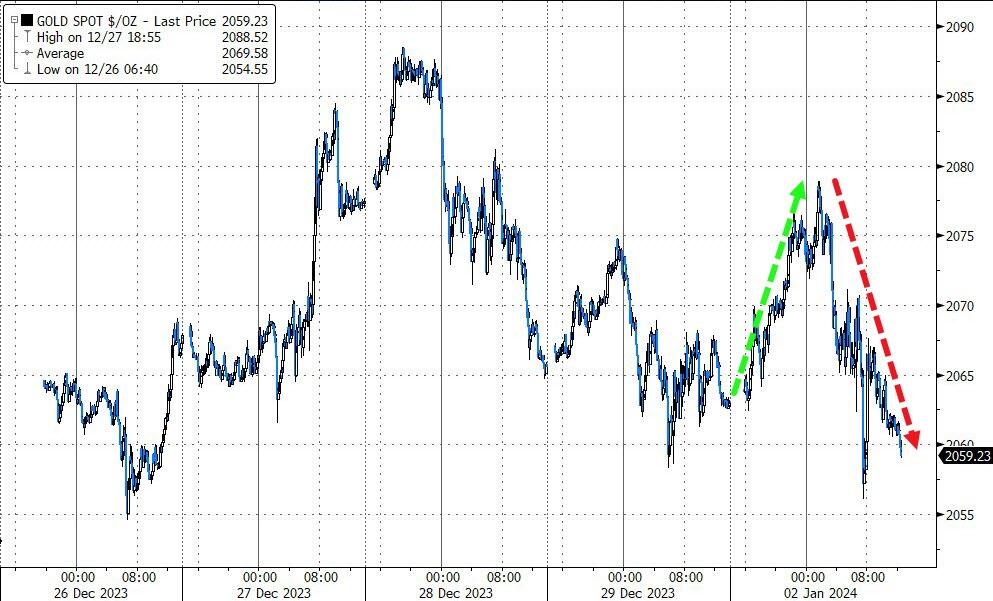
The dollar’s strength was bad news for gold, but the precious metal managed to limit its losses for the day.
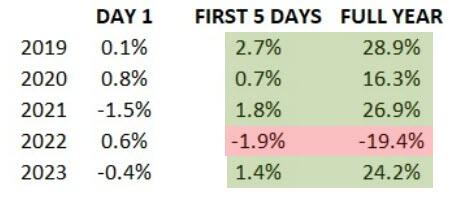
Traders are keen to see how the first five trading days of the year play out. Historically, they have been a good indicator of how the year will end. A positive start means a positive finish, and vice versa.
This chart shows the correlation. So, will the market turn around or keep falling?
2. Current “Buy” Cycles (effective 11/21/2023)
Our Trend Tracking Indexes (TTIs) have both crossed their trend lines with enough strength to trigger new “Buy” signals. That means, Tuesday, 11/21/2023, was the official date for these signals.
If you want to follow our strategy, you should first decide how much you want to invest based on your risk tolerance (percentage of allocation). Then, you should check my Thursday StatSheet and Saturday’s “ETFs on the Cutline” report for suitable ETFs to buy.
3. Trend Tracking Indexes (TTIs)
The S&P and Nasdaq showed little movement as they stayed below their opening levels throughout the day. The market was indecisive and lacked direction.
Our TTIs also remained flat on this uneventful start of 2024.
This is how we closed 1/2/2024:
Domestic TTI: +8.58% above its M/A (prior close +8.54%)—Buy signal effective 11/21/2023.
International TTI: +7.02% above its M/A (prior close +7.27%)—Buy signal effective 11/21/2023.
All linked charts above are courtesy of Bloomberg via ZeroHedge.
Contact Ulli