Earnings And Tax Cut Hopes Drive Markets

Ulli Market Commentary Contact

[Chart courtesy of MarketWatch.com]
  1. Moving the Markets

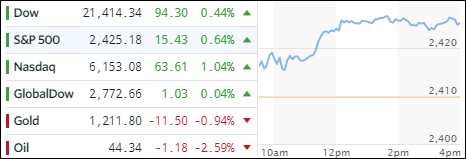
Caterpillar and McDonalds combined to continue yesterday’s rally with Trump’s planned tax cut announcement, scheduled for tomorrow, providing the emotional fire power. The Nasdaq managed to conquer the 6,000 level and closed solidly above it in part due to gains by heavyweights Apple and Microsoft.

So far, overall profits of S&P companies are estimated to have risen 11.4% in the first quarter, which would be the most since 2011. However, the devil always is always in the details, although these days the only thing that matters is the headline number. Case in point is Caterpillar and its “tremendous earnings growth” which, when taking out adjustments and looking at real GAAP EPS, shows an entirely different picture as you can read here.

The last couple of days have been extremely painful for those professional investors (and amateurs) who had accumulated short positions. They were squeezed and most had to cover, meaning they had to buy offsetting long positions to cover their shorts, thereby contributing to the bullish theme of this week.

Short interest is measured and is considered the secret sauce that can extend a bull market’s life. However, the latest numbers showing short interest for the market’s most liquid ETF (S&P 500) having currently dropped to levels not seen since May 2007 just prior the S&P’s top and free fall. This begs the question as to how much ammunition will be left to have any effect on the next short squeeze, which will be needed to push equities higher.

Read More

Relief And Hope Combine To Power Equities

Ulli Market Commentary Contact

[Chart courtesy of MarketWatch.com]
  1. Moving the Markets

The 1st round of the French election results provided relief and hope that the current leading candidate of left wing persuasion (Emmanuel Macron) will be the one winning the final election in a couple of weeks by defeating the right-wing anti-euro and anti-establishment Marine Le Pen in a run-off.

While Macron’s lead is fairly small, hope was high that the market favorite will become France’s next leader. Global equities shifted into rally mode with the French CAC 400 gaining +4.14%. All major indexes joined the fun, but the Nasdaq fell just short of conquering the 6,000 milestone marker.

Not to be outdone by international events, President Trump stepped up to the plate ahead of his anticipated tax announcement on Wednesday and “ordered” his aides to accelerate efforts to create a tax plan “slashing the corporate rate to 15% and prioritizing cuts in taxes over an attempt to not increase the deficit.” Let’s see how much opposition this idea will create and if it will be DOA.

Interest rates rose with the yield on the 10-year Treasury shooting up +1.79% to end at 2.28%, while the US dollar index gapped down to close at 98.97 and is in danger of breaking its 200-day M/A to the downside. That would be bearish as this support line has held since October 2016.

With the markets being caught up in euphoria, let me again be the voice of reason by pointing to the following two charts that require no comment or explanation:

Read More

One Man’s Opinion: Why The Big Banks Are Terrified Of Le Pen Winning In France (But Not BREXIT Or Trump)

Ulli Market Review Contact

By Gains, Pains & Capital

France holds the first round of its Presidential election this weekend.

The big worry for the markets is the fact that anti-Euro candidate Marin Le Pen could potentially win.

Now, the polls show Le Pen as having NO chance of becoming Prime Minister.

Of course, the polls also showed that BREXIT would not happen and Hillary Clinton had a 98% of becoming President.

We all know how those turned out.

“So what?” one might ask, “why would a Le Pen victory matter? Both BREXIT and Trump’s Presidential election ignited massive stock market rallies… why wouldn’t France leaving the Euro do the same?”

One word…

Collateral.

The big problem for EU members from is debt.

Read More

ETFs On The Cutline – Updated Through 04/21/2017

Ulli ETFs on the Cutline Contact

Below please find the latest High Volume ETFs Cutline report, which shows how far above or below their respective long-term trend lines (39 week SMA) my currently tracked ETFs are positioned.

This report covers the HV ETF Master List from Thursday’s StatSheet and includes 366 High Volume ETFs ETFs, defined as those with an average daily volume of more than $5 million, of which currently 256 (last week 246) are hovering in bullish territory. The yellow line separates those ETFs that are positioned above their trend line (%M/A) from those that have dropped below it.

Take a look:

The HV ETF Master Cutline Report            

In case you are not familiar with some of the terminology used in the reports, please read the Glossary of Terms.

If you missed the original post about the Cutline approach, you can read it here.

ETF Tracker Newsletter For April 21, 2017

Ulli ETF Tracker Contact

ETF Tracker StatSheet

https://theetfbully.com/2017/04/weekly-statsheet-etf-tracker-newsletter-updated-04202017/

EQUITIES UP FOR THE WEEK BUT SLIPPING BEFORE THE FRENCH ELECTIONS

[Chart courtesy of MarketWatch.com]
  1. Moving the Markets

Cautiousness prevailed prior to the closely contested 1st round of the French elections this weekend with equities pulling back but showing green numbers for the week as the S&P 500 gained +0.86%.

ZH summed the past 5 trading days up nicely by observing:

  1. Transportation sector best week in 4 months
  2. Small Caps best week in 4 months
  3. Nasdaq best week in 2 months
  4. S&P 500 best week in 2 months
  5. Dow best week in 7 weeks

On the other hand, bad news, like the biggest drop in US Macro Data in 6 years, was simply ignored and not reported by MSM. News from Trump at mid-day about his “greatest tax cut ever” caused a quick rebound, which was pretty much erased by day’s end.

The yield on the 10-year Treasury remained unchanged from yesterday but ended lower for the week. The dollar index inched higher but remains below its psychologically important 100 level. Gold gained a tad after being slammed 3 times this week but is still attempting to break through its 1,300 glass ceiling.

All eyes are on the French elections, the outcome of which can be “market moving” even though it’s only round one of two, with number two being on deck in 2 weeks.

Read More

Weekly StatSheet For The ETF Tracker Newsletter – Updated Through 04/20/2017

Ulli Uncategorized Contact

ETF Data updated through Thursday, April 20, 2017

Methodology/Use of this StatSheet:

  1. From the universe of over 1,800 ETFs, I have selected only those with a trading volume of over $5 million per day (HV ETFs), so that liquidity and a small bid/ask spread are assured.
  2. Trend Tracking Indexes (TTIs)

Buy or Sell decisions for Domestic and International ETFs (section 1 and 2), are made based on the respective TTI and its position either above or below its long-term M/A (Moving Average). A crossing of the trend line from below accompanied by some staying power above constitutes a “Buy” signal. Conversely, a clear break below the line constitutes a “Sell” signal. Additionally, I use a 7.5% trailing stop loss on all positions in these categories to control downside risk.

  1. All other investment arenas do not have a TTI and should be traded based on the position of the individual ETF relative to its own respective trend line (%M/A). That’s why those signals are referred to as a “Selective Buy.” In other words, if an ETF crosses its own trendline to the upside, a “Buy” signal is generated. Since these areas tend to be more volatile, I recommend a wider trailing sell stop of 7.5% -10% depending on your risk tolerance.

If you are unfamiliar with some of the terminology, please see Glossary of Terms and new subscriber information in section 9.


  1. DOMESTIC EQUITY ETFs: BUY — since 4/4/2016

Click on chart to enlarge

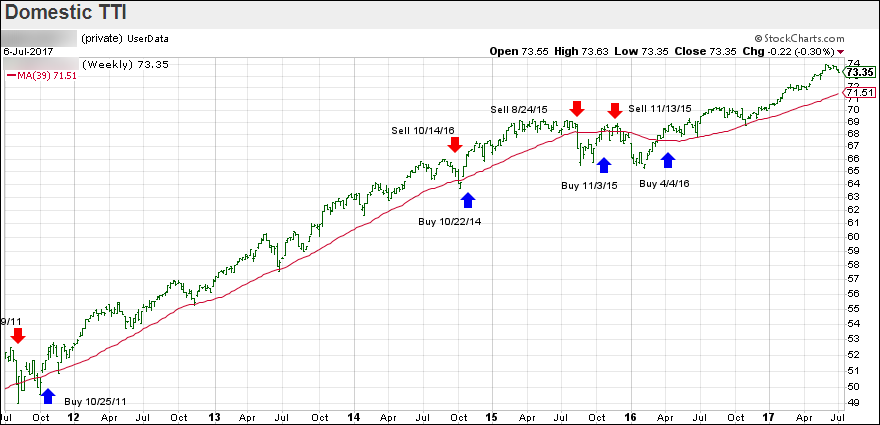
Our main directional indicator, the Domestic Trend Tracking Index (TTI-green line in the above chart) is positioned above its long-term trend line (red) by +2.63% after having generated a new Domestic Buy signal effective 4/4/2016 as posted.

Read More