Equities On A One-Way Street

Ulli Market Commentary Contact

[Chart courtesy of MarketWatch.com]
  1. Moving the Markets

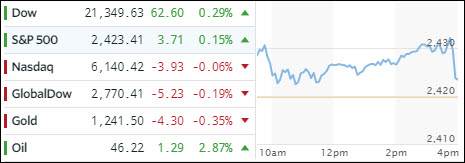
After a higher opening, the markets remained steadfast and unwavering in making this session a positive one after the past few of days of floundering. Despite this effort, the S&P 500 still remains a few points lower than it started the month.

Solid earnings by American Express stabilized the financial sector for the time being with the major banks gaining for a change as the financial sector ETF XLF added +1.69% after being on a downward slide for 6 weeks as I commented on yesterday.

SmallCaps outperformed by adding +1.06% compared to +0.77% for LargeCaps and +0.79% for MidCaps. Looking at the bigger picture, the Dow is the laggard by being stuck below its 50-day M/A while the S&P 500 is hugging it and Nasdaq hovers clearly above it showing the most upward momentum. You would think that with the Nasdaq touching new all-time highs, all is well in that sector, including earnings. But you would be wrong.

Take a look at this chart:

Read More

A Dying Dead-Cat-Bounce

Ulli Market Commentary Contact

[Chart courtesy of MarketWatch.com]
  1. Moving the Markets

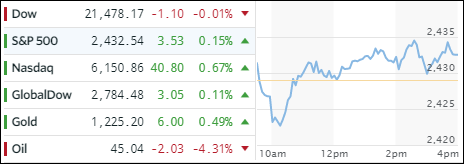
An encouraging morning rally ran out of steam mid-day with the major indexes heading south and closing below their unchanged lines. The exception was the Nasdaq, which managed to cling to a gain of +0.23%.

No macro data points were released today, but the weakness in the banking sector, which I addressed yesterday, continued with Goldman Sachs slipping further. IBM’s weak quarterly numbers were the other culprit; those two heavyweights contributed to about 50% of the Dow’s loss.

Treasury yields bounced a little with the 10-year recouping 3 points or +1.38% after yesterday’s loss of -3.54%. The US dollar followed suit and climbed +0.24%, but still remains below its 100 level.

The financial ETF XLF has been on a slide ever since hitting this year’s top around March 1st. Why is this important? The Trump rally, which started on November 7, was led by the financials with the S&P 500 following suit. This trend appears to have come to an end and has reversed as the following chart shows:

Read More

US Dollar And Bond Yields Slammed

Ulli Market Commentary Contact

[Chart courtesy of MarketWatch.com]
  1. Moving the Markets

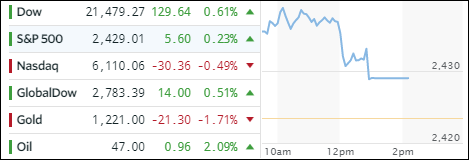
Just yesterday, I talked about how bond yields have been slipping and sliding despite the Fed’s efforts of hiking rates in December and March. The 10-year yield has dropped from 2.62% to 2.26% over the past 4 weeks. That trend accelerated today as that yield got slammed even more ending up at 2.18% for a loss of -3.54%.

Bond markets are usually ahead of stock markets in terms of anticipating future events, and what this move indicates is what I have been talking about for a long time, namely that the economy is heading south in a big way. This has been evident when looking at hard data, such as GDP forecast, EPS expectations, retail sales, subprime auto loans and commercial real estate just to name a few. The only questions remains: when will the equity market get the message?

Not helping matters was a sharp tumble in the dollar (-0.79%) as the index broke below its psychologically important 100 level to close at 99.40. That is only a slip away from dropping below its 200-day M/A, which has functioned as a support level as recently as late March. Banks got hammered again with the loser of the year award going to Goldman Sachs which, as of March 1st had sported a YTD gain of almost 6% and has now slipped into negative territory showing a YTD performance of -9.73%.

In case you like to see the visual, here it is:

Read More

Bounce-Back Monday

Ulli Market Commentary Contact

[Chart courtesy of MarketWatch.com]
  1. Moving the Markets

To me, today’s trading session had the look of a relief rally after last week’s sell-off, and the fact that the war mongering with N. Korea did not turn into anything more but jawboning over the Holiday weekend.

The major indexes gained solidly with the S&P 500 trying to make up the losses of the last 5 trading sessions but fell short by a few points. Oddly enough, interest rates have been slipping and sliding since early March when the 10-year T-bond peaked at a yield of 2.62% compared to today’s close of 2.26%. What’s going on here? The Fed has raised rates twice, namely in December and March and threatened at least 2 more hikes in 2017, yet rates are declining.

The answer is simple in that the bond market has not priced in any more hikes due to the fact that economic data points are weakening by the day with thousands of retail stores closing accompanied by 10’s of thousands of job losses while GDP is quickly stumbling towards zero. So, the Fed’s hike appears to be more a measure of caution so that they have some ammo to lower rates again once the long overdue recession is finally recognized.

The following chart makes this abundantly clear:

Read More

One Man’s Opinion: Just A Quick Reminder: The Federal Reserve Is Almost Insolvent

Ulli Market Review Contact

By Sovereign Man

September 10, 2008 was one of the last “normal” days in the world of banking and finance.

That afternoon, the US Federal Reserve published its routine, weekly balance sheet report, indicating that the central bank had total assets worth around $925 billion.

Just a few days later, Lehman Brothers filed for bankruptcy, kicking off the most severe economic crisis since the Great Depression.

And almost immediately the Fed launched a series of unprecedented measures in a desperate attempt to contain the damage.

They called it “Quantitative Easing”, which was a fancy way of saying the Federal Reserve was printing money and giving it to the banks and US government.

When the commercial banks needed to sell their non-performing toxic assets, the Fed printed money to buy that garbage.
Read More

ETFs On The Cutline – Updated Through 04/13/2017

Ulli ETFs on the Cutline Contact

Below please find the latest High Volume ETFs Cutline report, which shows how far above or below their respective long-term trend lines (39 week SMA) my currently tracked ETFs are positioned.

This report covers the HV ETF Master List from Thursday’s StatSheet and includes 366 High Volume ETFs ETFs, defined as those with an average daily volume of more than $5 million, of which currently 246 (last week 241) are hovering in bullish territory. The yellow line separates those ETFs that are positioned above their trend line (%M/A) from those that have dropped below it.

Take a look:

The HV ETF Master Cutline Report            

In case you are not familiar with some of the terminology used in the reports, please read the Glossary of Terms.

If you missed the original post about the Cutline approach, you can read it here.