Volatility Spike Kills Equities

Ulli Market Commentary Contact

[Chart courtesy of MarketWatch.com]
  1. Moving the Markets

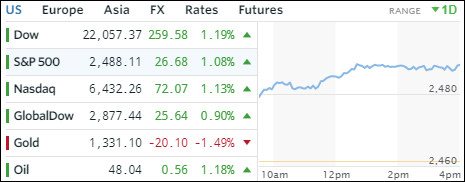
If you viewed Wednesday’s market ramp with the benefit of hindsight by looking at today’s losing session, it would appear that yesterday was a blow-off top; or so it seems. There was nothing positive surrounding equities, which ended up down for the day but, considering that the VIX at the lows had jumped +51.1% while the S&P 500 at its low point was down only -1.44%, it could have been a lot worse. The divergence was short lived with the VIX collapsing back to 11 and the S&P cutting its losses to -0.86%.

Much of the confusion was caused by the Fed mouthpiece Bullard confirming that the Fed may have lost control of the markets, when he said:

Market reaction to March tightening has not been good, would have expected yields to rise with policy rate.

That was enough to accelerate downward momentum, and should it get worse, Bullard offered a solution for that as well:

Need to create policy space in good times in case need more QE in the future

[Hat tip goes to ZH for these quotes]

So, there you have it. The interest hikes are merely a sign of building up more ammunition just in case the markets head south in a big time, at which point we can expect the Fed to step in with another reckless money printing (QE) spree. After all, a normal correction necessary in a business cycle is not longer permissible.

Interest rates spiked causing the 20-year bond ETF TLT to lose -0.84%. That’s unusual in that during equity downturns bonds are expected to be the savior by gaining in value and not going slipping as well. Even the whipping boy of the year, AKA the US dollar, headed deeper into negative territory with UUP slipping for the third day in a row by surrendering -0.48%.

Read More

Dollar Dumps As Nasdaq Jumps

Ulli Market Commentary Contact

[Chart courtesy of MarketWatch.com]
  1. Moving the Markets

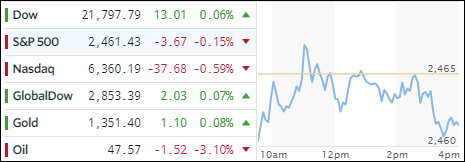
In a total reversal from yesterday, equities jumped right after the opening bell and never looked back in an attempt to recover Tuesday’s losses, a feat which was largely accomplished with the S&P posting its biggest one-day gain in a couple of months.

Economic data points did not assist in today’s ramp as pending home sales tumbled in May -0.8% MoM and were revised even lower in April. So, the driver for today’s session turned out to be nothing more but wishful thinking that Trump’s tax cut will eventually become reality, the US economy is projected to pick up growth and expected earnings are supposed to be better than estimates.

The tech sector (QQQ) led the charge (+1.44%) and the FANG stocks bounced nicely off their Tuesday lows, which was followed by the Financials (IYF) with a +1.18% gain. Oil joined in for a change but did not manage to break above its $45 level.

Interest rates were not an influential factor with the 10-year yield limping higher by 1 basis point to end the day at 2.22% causing the 20-year T-Bond ETF (TLT) to lose -0.33%. The US dollar (UUP) dumped again, lost -0.32% and made new lows for 2017 in the process. YTD, the dollar has now lost -7.5% of its value, as the chart below shows:

Read More

Nasdaq Gets Whipped And Bonds Get Clipped

Ulli Market Commentary Contact

[Chart courtesy of MarketWatch.com]
  1. Moving the Markets

There simply weren’t any news reports positive enough to keep the major indexes above the unchanged line. First, it was the Fed and its mouthpieces pretty much talking down the markets. ZH summed it up as follows:

Yellen – “We have been in an economy with low interest rates for some time, and that influences asset prices… Asset valuations are somewhat rich by traditional valuations like price-earnings ratios… Some asset valuations look high. There is no certainty about that.”

 Williams – “I am somewhat concerned about the complacency in the market. If you look at these measures of uncertainty, like the VIX measure, or other indicators, there seems to be a priced-to-perfection attitude out there… The stock market still seems to be running very much on fumes…”

 Fischer – Calls for “close monitoring” of rising risk appetites…”Equity P/E ratios are near top of historical levels… it would be foolish to think all risks eliminated… Sees notable uptick in risk appetites in asset markets… Corporate sector notably leveraged…”

Later in the session, downward momentum accelerated when Republican Senate leaders postponed the vote on the controversial health-care bill until after the July 4th holiday, which did not exactly instill confidence in its outcome.

The Nasdaq got clobbered the most by losing -1.61% and is now showing a negative return for June. It’s not surprising that the FANGs were hammered as well dropping 4% from yesterday’s close.

Bonds got hit hard as the 10-year yield jumped 7 basis points to 2.21%, which sent the 20-year T-Bond (TLT) sliding and surrendering -1.07%. Not to be outdone, the US Dollar tumbled along losing -1.11% (UUP) in the process wiping out recent gains and ending up back at October 2017 lows. In other words, the entire “Trump US dollar bump” has been more than wiped out with only equities not having gotten the message.

Read More

Skidding Off The Highs

Ulli Market Commentary Contact

[Chart courtesy of MarketWatch.com]
  1. Moving the Markets

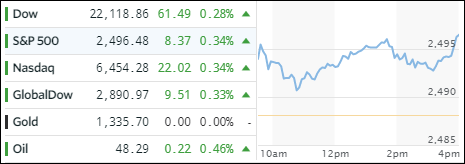
It was another roller coaster session with the major indexes ramping higher right out of the gate, only to see early gains evaporate, as Dow ended a string of daily losses at four, but only by the tiniest of margins. So did the S&P 500, but the Nasdaq stumbled and closed the day in the red. Emerging markets reigned superior with SCHE adding a solid +1.13% in an otherwise momentum-less trading session.

However, some momentum was present in the precious metals markets but, unfortunately, it was the downside. Gold flash-crashed this morning plunging $18, or 1.6%, to $1,236 on massive volume, as someone dumped $2 billion (over 18,000 contracts) in a matter of seconds. Naturally, silver was dragged down with it in what was an obvious attempt to manipulate prices. After all, if you wanted to sell at the highest price you would do it carefully and deliberately and not all at once.

Economic data points continued their nose dive with Durable Goods and the Chicago Fed’s National Activity Index both tumbling and missing expectations by a huge margin. As a result, the Citi Macro Surprise Index slumped to its lowest level since the middle of 2011.

Treasury yields fell with the 10-year bond now yielding 2.14%, which is its lowest since November 2016. The US dollar had its own roller-coaster ride, first sharply dropping on the weak economic data points and then rallying to manage a gain of +0.06%, as measured by UUP.

Read More

One Man’s Opinion: “Nobody In Power Is Paying Attention To How Close We Are To The Edge”

Ulli Market Review Contact

By Howard Kunstler

As our politicos creep deeper into a legalistic wilderness hunting for phantoms of Russian collusion, nobody pays attention to the most dangerous force in American life: the unraveling financialization of the economy.

Financialization is what happens when the people-in-charge “create” colossal sums of “money” out of nothing — by issuing loans, a.k.a. debt — and then cream off stupendous profits from the asset bubbles, interest rate arbitrages, and other opportunities for swindling that the artificial wealth presents. It was a kind of magic trick that produced monuments of concentrated personal wealth for a few and left the rest of the population drowning in obligations from a stolen future. The future is now upon us.

Financialization expressed itself in other interesting ways, for instance the amazing renovation of New York City (Brooklyn especially). It didn’t happen just because Generation X was repulsed by the boring suburbs it grew up in and longed for a life of artisanal cocktails. It happened because financialization concentrated immense wealth geographically in the very few places where its activities took place — not just New York but San Francisco, Washington, and Boston — and could support luxuries like craft food and brews.

Read More

ETFs On The Cutline – Updated Through 06/23/2017

Ulli ETFs on the Cutline Contact

Below please find the latest High Volume ETFs Cutline report, which shows how far above or below their respective long-term trend lines (39 week SMA) my currently tracked ETFs are positioned.

This report covers the HV ETF Master List from Thursday’s StatSheet and includes 366 High Volume ETFs ETFs, defined as those with an average daily volume of more than $5 million, of which currently 276 (last week 277) are hovering in bullish territory. The yellow line separates those ETFs that are positioned above their trend line (%M/A) from those that have dropped below it.

Take a look:

The HV ETF Master Cutline Report            

In case you are not familiar with some of the terminology used in the reports, please read the Glossary of Terms.

If you missed the original post about the Cutline approach, you can read it here.