Nasdaq Outperforms; Energy Sector Gets Slammed

Ulli Market Commentary Contact

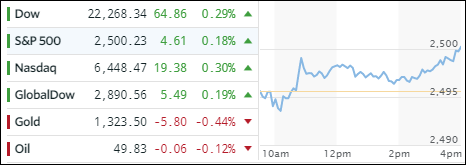
[Chart courtesy of MarketWatch.com]
  1. Moving the Markets

It was a tale of two markets as the Nasdaq was propelled higher with semiconductors (SMH) reversing their recent downtrend by charging ahead +1.90%. The Dow closed about unchanged, while the S&P 500 managed to eke out a small gain of +0.15%.

Things looked ugly in the energy sector as oil got hit hard and lost -4.31% following Russia’s announcement that it no longer would support output cuts. In fact, the entire energy sector got slammed with the widely followed XLE dropping -1.95%, its worst loss in 4 months.

Interest rates pulled back with the 10-year Bond now yielding 2.24% down -0.85% or 2 basis points from Tuesday. The US dollar managed a slight rebound for a 3-session gain off the 9-month lows made in late July.

Read More

Nasdaq Slips But Dow And S&P 500 Edge Up

Ulli Uncategorized Contact

Due to the shortened pre-holiday session, there will be no market report today but only an update to our Trend Tracking Indexes (TTIs):

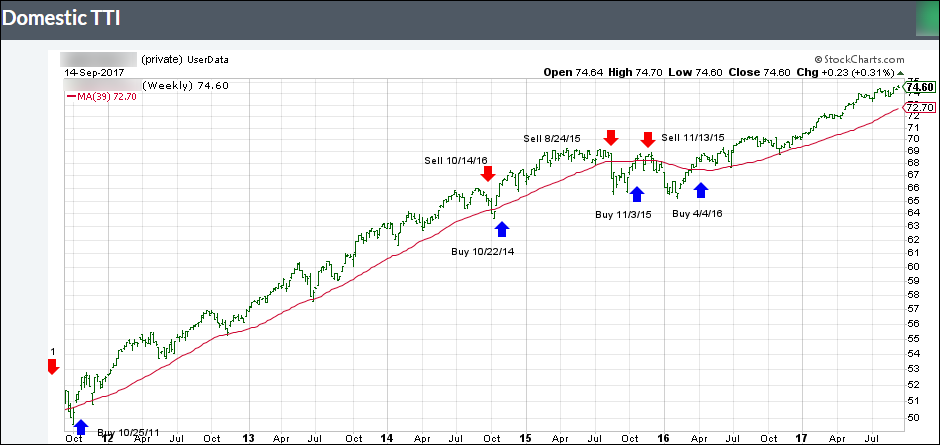
The TTI’s were mixed with the Domestic one slipping a tad while the International one gained solidly.

Here’s how we closed 7/3/2017:

Domestic TTI: +2.98% (last close +3.01%)—Buy signal effective 4/4/2016

International TTI: +7.19% (last close +6.89%)—Buy signal effective 7/19/2016

I will resume regular reporting on Wednesday afternoon.

One Man’s Opinion: Get Ready For “QT1”: A First Look At The Fed’s Hidden Policy

Ulli Market Review Contact

By James Rickards

The Federal Reserve is now setting out on a new path for quantitative tightening (QT) after nine years of unconventional quantitative (QE) easing policy. It is the evil twin of QE which was used to ease monetary conditions when interest rates were already zero.

First, it is important to examine QE and QT in a broader context of the Fed’s overall policy toolkit. Understanding the many tools the Fed has, which of them they’re using and what the impacts are will allow you to distinguish between what the Fed thinks versus what actually happens.

We have a heavily manipulated system. For years, if not decades, monetary policy has been flipping back and forth between how the economy actually works and what the Fed believes works.

QE was a policy of printing money by buying securities from primary dealers and to ease monetary conditions when interest rates were at zero. QT takes a different approach.

In QT, the Fed will “sell” securities to the primary dealers, take the money, and make it disappear. This is an attempt to ultimately reduce the money supply and implement a policy of tightening money.

Read More

ETFs On The Cutline – Updated Through 06/30/2017

Ulli ETFs on the Cutline Contact

Below please find the latest High Volume ETFs Cutline report, which shows how far above or below their respective long-term trend lines (39 week SMA) my currently tracked ETFs are positioned.

This report covers the HV ETF Master List from Thursday’s StatSheet and includes 366 High Volume ETFs ETFs, defined as those with an average daily volume of more than $5 million, of which currently 276 (last week 276) are hovering in bullish territory. The yellow line separates those ETFs that are positioned above their trend line (%M/A) from those that have dropped below it.

Take a look:

The HV ETF Master Cutline Report            

In case you are not familiar with some of the terminology used in the reports, please read the Glossary of Terms.

If you missed the original post about the Cutline approach, you can read it here.

ETF Tracker Newsletter For June 30, 2017

Ulli ETF Tracker Contact

ETF Tracker StatSheet

https://theetfbully.com/2017/06/weekly-statsheet-etf-tracker-newsletter-updated-06292017/


HOVERING ABOVE THE UNCHANGED LINE

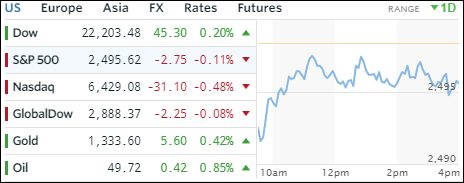
[Chart courtesy of MarketWatch.com]
  1. Moving the Markets

The Dow and S&P 500 managed to hang on to slight gains despite a last hour sell-off, which pushed the Nasdaq back into the red for the day. While the major indexes posted had a solid quarter, the month of June was problematic with roller coaster rides in healthcare and technology limiting gains; nevertheless the S&P 500 closed in the green although by only a meager +0.46%.

The Nasdaq was the biggest loser while SmallCaps ended up being the biggest winner. Crude Oil surprised by adding +2.87% for the session and reclaiming its recently lost $46 level. Interest rates rose causing the 20-year T-bond ETF TLT to lose another -0.23%. The US dollar, after having posted 8 month lows yesterday, rebounded a tad with UUP adding +0.16%.

A number of high profile fund managers have recently come out and opined about the extreme evaluations and given forecasts about the precarious situation the economy and the markets find themselves in. Today, it was none other than BofA chiming in with things like:

Central banks have exacerbated inequality via Wall St inflation & Main St deflation

It is “no longer politically acceptable to stoke Wall St bubble; two ways to cure inequality… you can make the poor richer…or you can make the rich poorer…they have failed to boost wage expectations/inflation expectation, “animal spirits” on Main St… so Fed/ECB now tightening to make Wall St poorer”

And then this:

We don’t think this is “big top” in stocks; greed harder to kill than fear; don’t think this “big top” in stocks, would be surprised if bull market which began with SPX 666 ends before 6666 on the Nasdaq… summer 2017 = significant inflection point in central bank liquidity trade…will likely lead to “Humpty-Dumpty” big fall in market in autumn, in our view.

 But Big Top likely occurs when Peak Liquidity meets Peak Profits. We think that’s an autumn not summer story.

We’ll have to wait and see if any of these thoughts become reality, but it would not surprise me one bit.

Read More

Weekly StatSheet For The ETF Tracker Newsletter – Updated Through 06/29/2017

Ulli ETF StatSheet Contact

ETF Data updated through Thursday, June 29, 2017

Methodology/Use of this StatSheet:

  1. From the universe of over 1,800 ETFs, I have selected only those with a trading volume of over $5 million per day (HV ETFs), so that liquidity and a small bid/ask spread are assured.
  2. Trend Tracking Indexes (TTIs)

Buy or Sell decisions for Domestic and International ETFs (section 1 and 2), are made based on the respective TTI and its position either above or below its long-term M/A (Moving Average). A crossing of the trend line from below accompanied by some staying power above constitutes a “Buy” signal. Conversely, a clear break below the line constitutes a “Sell” signal. Additionally, I use a 7.5% trailing stop loss on all positions in these categories to control downside risk.

  1. All other investment arenas do not have a TTI and should be traded based on the position of the individual ETF relative to its own respective trend line (%M/A). That’s why those signals are referred to as a “Selective Buy.” In other words, if an ETF crosses its own trendline to the upside, a “Buy” signal is generated. Since these areas tend to be more volatile, I recommend a wider trailing sell stop of 7.5% -10% depending on your risk tolerance.

If you are unfamiliar with some of the terminology, please see Glossary of Terms and new subscriber information in section 9.


  1. DOMESTIC EQUITY ETFs: BUY — since 4/4/2016

Click on chart to enlarge

Our main directional indicator, the Domestic Trend Tracking Index (TTI-green line in the above chart) is positioned above its long-term trend line (red) by +3.14% after having generated a new Domestic Buy signal effective 4/4/2016 as posted.

Read More