
- Moving the Markets
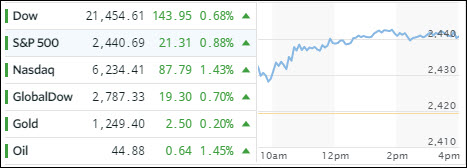
In a total reversal from yesterday, equities jumped right after the opening bell and never looked back in an attempt to recover Tuesday’s losses, a feat which was largely accomplished with the S&P posting its biggest one-day gain in a couple of months.
Economic data points did not assist in today’s ramp as pending home sales tumbled in May -0.8% MoM and were revised even lower in April. So, the driver for today’s session turned out to be nothing more but wishful thinking that Trump’s tax cut will eventually become reality, the US economy is projected to pick up growth and expected earnings are supposed to be better than estimates.
The tech sector (QQQ) led the charge (+1.44%) and the FANG stocks bounced nicely off their Tuesday lows, which was followed by the Financials (IYF) with a +1.18% gain. Oil joined in for a change but did not manage to break above its $45 level.
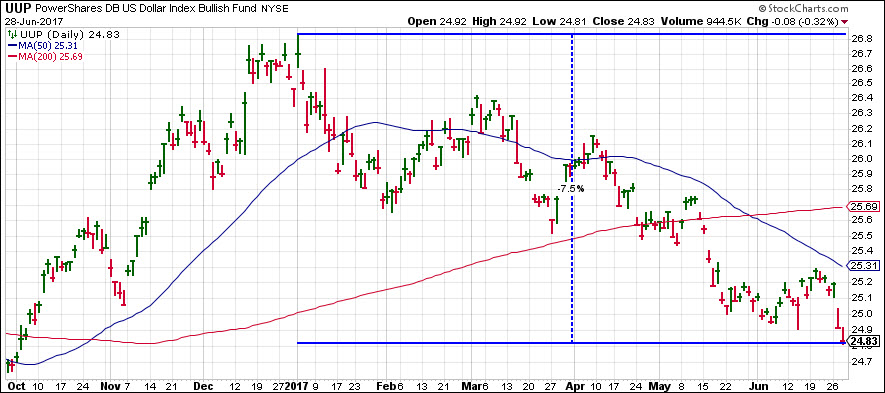
Interest rates were not an influential factor with the 10-year yield limping higher by 1 basis point to end the day at 2.22% causing the 20-year T-Bond ETF (TLT) to lose -0.33%. The US dollar (UUP) dumped again, lost -0.32% and made new lows for 2017 in the process. YTD, the dollar has now lost -7.5% of its value, as the chart below shows:
But, according to the Fed, annual inflation is running at less than 2%. Yeah, right.
- ETFs in the Spotlight (updated for 2017)
In case you missed the announcement and description of this section, you can read it here again.
It features 10 broadly diversified and sector ETFs from my HighVolume list as posted every Saturday. Furthermore, they are screened for the lowest MaxDD% number meaning they have been showing better resistance to temporary sell offs than all others over the past year.
The below table simply demonstrates the magnitude with which some of the ETFs are fluctuating in regards to their positions above or below their respective individual trend lines (%M/A). A break below, represented by a negative number, shows weakness, while a break above, represented by a positive percentage, shows strength.
For hundreds of ETF choices, be sure to reference Thursday’s StatSheet.
Year to date, here’s how the 2017 candidates have fared so far:
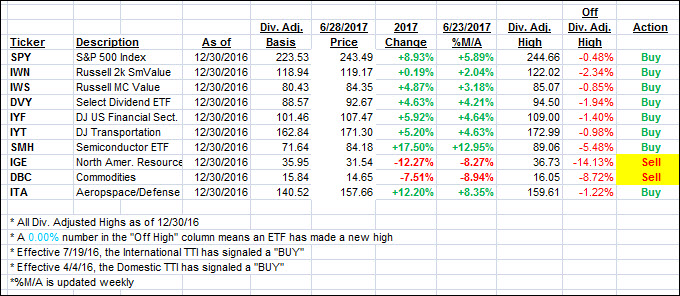
Again, the %M/A column above shows the position of the various ETFs in relation to their respective long term trend lines, while the trailing sell stops are being tracked in the “Off High” column. The “Action” column will signal a “Sell” once the -7.5% point has been taken out in the “Off High” column.
- Trend Tracking Indexes (TTIs)
Our Trend Tracking Indexes (TTIs) recovered as the bulls were clearly in charge for the day.
Here’s how we closed 6/28/2017:
Domestic TTI: +3.59% (last close +3.12%)—Buy signal effective 4/4/2016
International TTI: +7.93% (last close +7.23%)—Buy signal effective 7/19/2016
Disclosure: I am obliged to inform you that I, as well as my advisory clients, own some of the ETFs listed in the above table. Furthermore, they do not represent a specific investment recommendation for you, they merely show which ETFs from the universe I track are falling within the guidelines specified.
Contact Ulli