

- Moving the Markets
If you viewed Wednesday’s market ramp with the benefit of hindsight by looking at today’s losing session, it would appear that yesterday was a blow-off top; or so it seems. There was nothing positive surrounding equities, which ended up down for the day but, considering that the VIX at the lows had jumped +51.1% while the S&P 500 at its low point was down only -1.44%, it could have been a lot worse. The divergence was short lived with the VIX collapsing back to 11 and the S&P cutting its losses to -0.86%.
Much of the confusion was caused by the Fed mouthpiece Bullard confirming that the Fed may have lost control of the markets, when he said:
Market reaction to March tightening has not been good, would have expected yields to rise with policy rate.
That was enough to accelerate downward momentum, and should it get worse, Bullard offered a solution for that as well:
[Hat tip goes to ZH for these quotes]Need to create policy space in good times in case need more QE in the future
So, there you have it. The interest hikes are merely a sign of building up more ammunition just in case the markets head south in a big time, at which point we can expect the Fed to step in with another reckless money printing (QE) spree. After all, a normal correction necessary in a business cycle is not longer permissible.
Interest rates spiked causing the 20-year bond ETF TLT to lose -0.84%. That’s unusual in that during equity downturns bonds are expected to be the savior by gaining in value and not going slipping as well. Even the whipping boy of the year, AKA the US dollar, headed deeper into negative territory with UUP slipping for the third day in a row by surrendering -0.48%.
- ETFs in the Spotlight (updated for 2017)
In case you missed the announcement and description of this section, you can read it here again.
It features 10 broadly diversified and sector ETFs from my HighVolume list as posted every Saturday. Furthermore, they are screened for the lowest MaxDD% number meaning they have been showing better resistance to temporary sell offs than all others over the past year.
The below table simply demonstrates the magnitude with which some of the ETFs are fluctuating in regards to their positions above or below their respective individual trend lines (%M/A). A break below, represented by a negative number, shows weakness, while a break above, represented by a positive percentage, shows strength.
For hundreds of ETF choices, be sure to reference Thursday’s StatSheet.
Year to date, here’s how the 2017 candidates have fared so far:
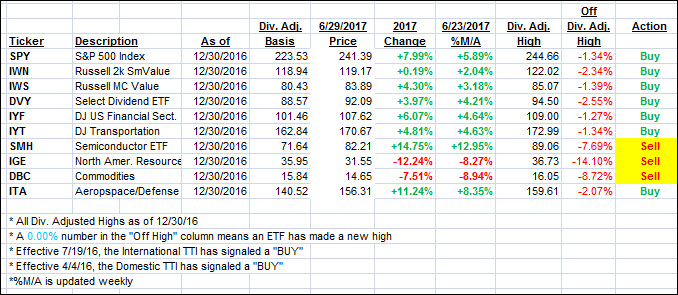
Again, the %M/A column above shows the position of the various ETFs in relation to their respective long term trend lines, while the trailing sell stops are being tracked in the “Off High” column. The “Action” column will signal a “Sell” once the -7.5% point has been taken out in the “Off High” column.
- Trend Tracking Indexes (TTIs)
Our Trend Tracking Indexes (TTIs) headed south as volatility spiked and the major indexes retreated.
Here’s how we closed 6/29/2017:
Domestic TTI: +3.14% (last close +3.59%)—Buy signal effective 4/4/2016
International TTI: +7.30% (last close +7.93%)—Buy signal effective 7/19/2016
Disclosure: I am obliged to inform you that I, as well as my advisory clients, own some of the ETFs listed in the above table. Furthermore, they do not represent a specific investment recommendation for you, they merely show which ETFs from the universe I track are falling within the guidelines specified.
Contact Ulli