ETF Tracker Newsletter For December 26, 2025

Ulli ETF Tracker Contact

ETF Tracker StatSheet          

You can view the latest version here.

STOCKS TRED WATER; METALS EXPLODE – PORTFOLIO SMILES ANYWAY
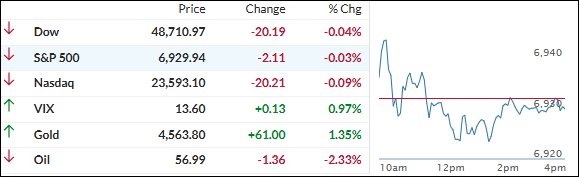
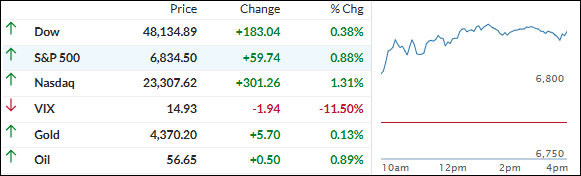
[Chart courtesy of MarketWatch.com]

  1. Moving the market

Traders came back from Christmas ready to buy, pushing the S&P 500 to a fresh record high in early trading.

The day itself was pretty sleepy—major indexes basically trod water and closed little changed—but the week told a happier story.

The S&P gained over 1%, the Dow and Nasdaq both up more than 1% too, putting us on track for the fourth weekly win in five. Classic post-Christmas quiet, but still grinding higher.

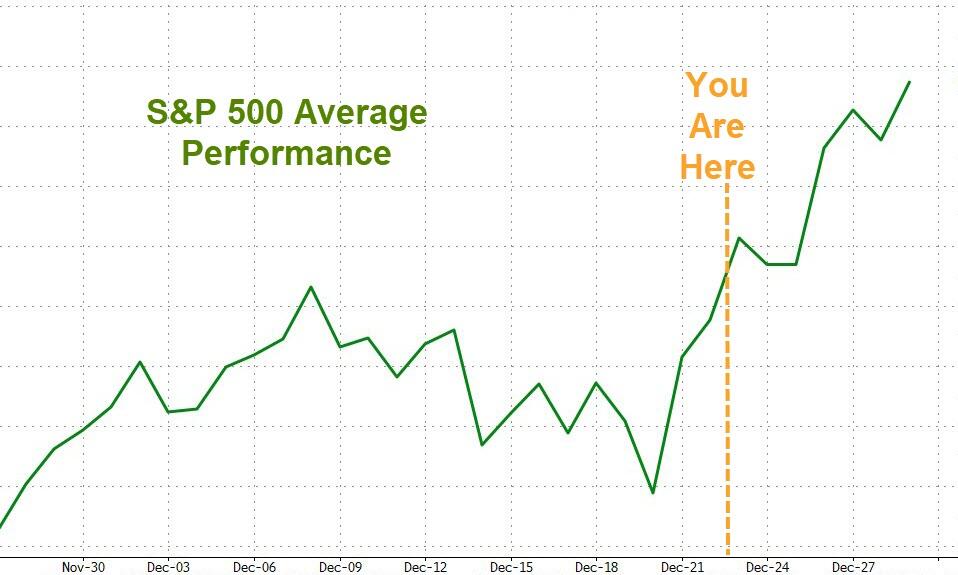
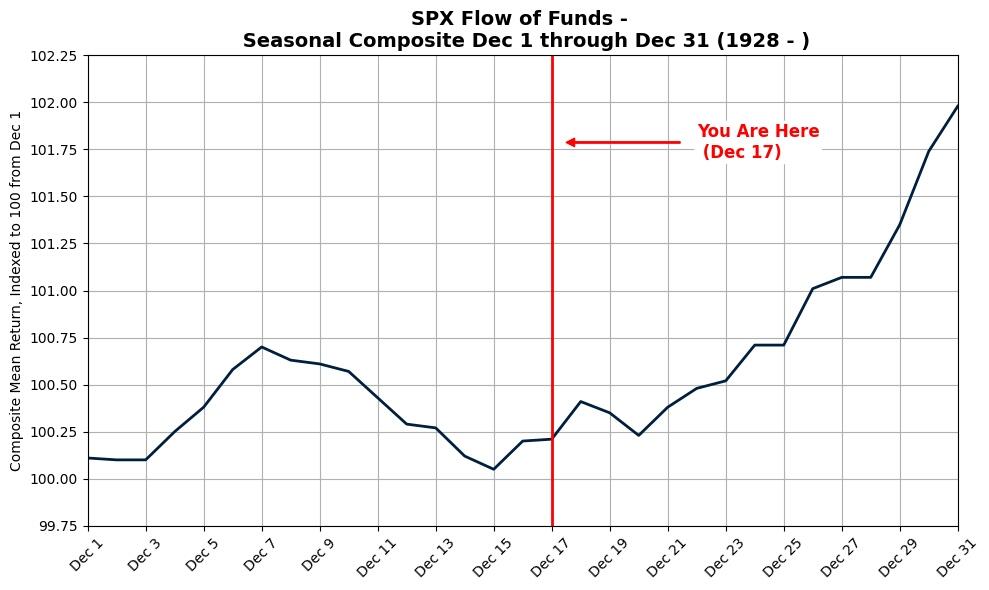
We’re smack in the middle of that historically sweet seasonal window, so everyone’s keeping an eye out for the famous “Santa Claus rally” (the last five trading days of the year plus the first two of January).

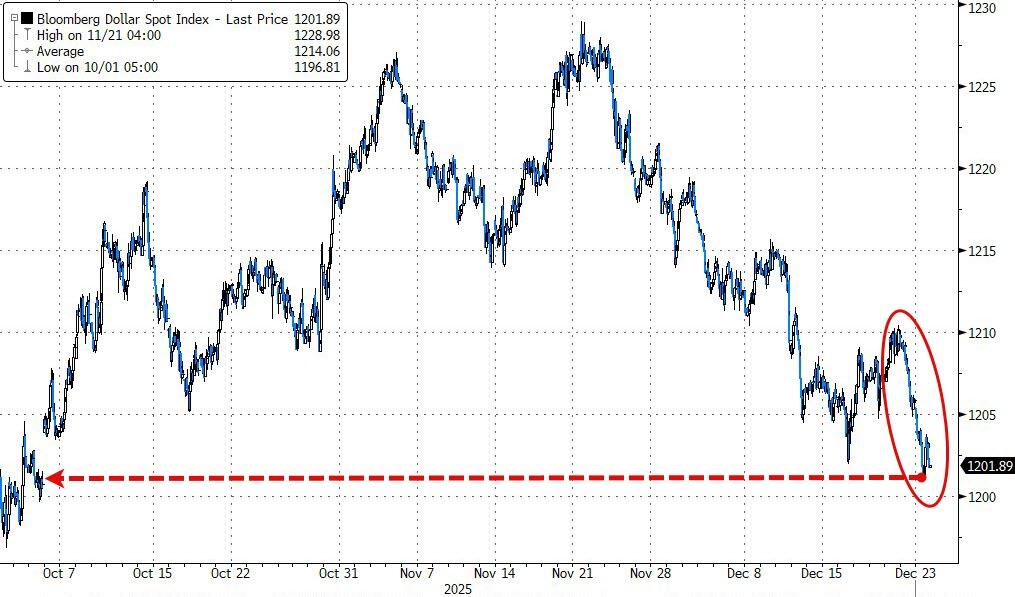
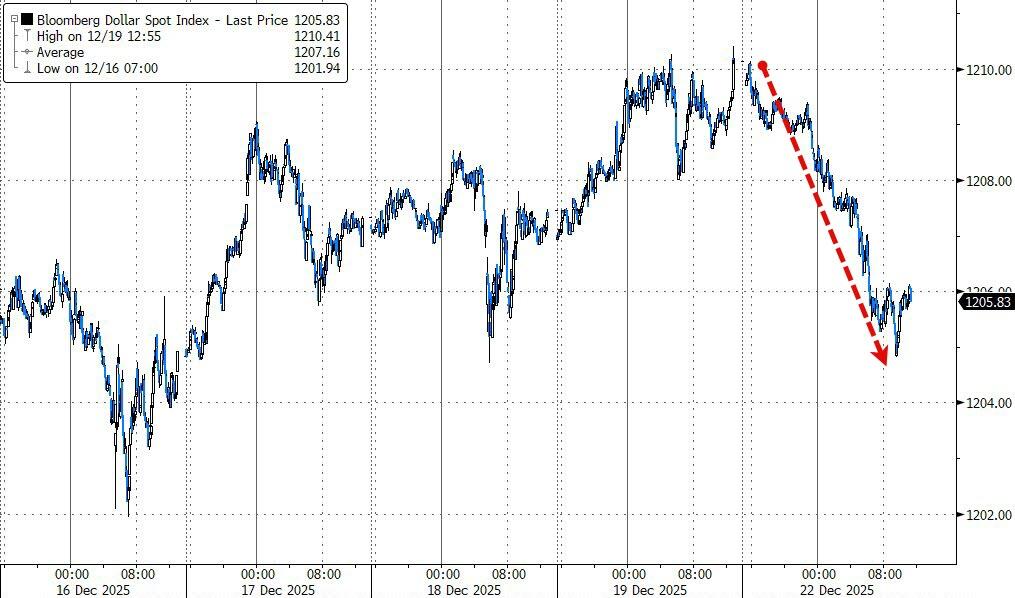
Bond yields finished the week flat, but the dollar had its worst week since June and closed at October lows. Today’s real fireworks? Once again in the metals corner:

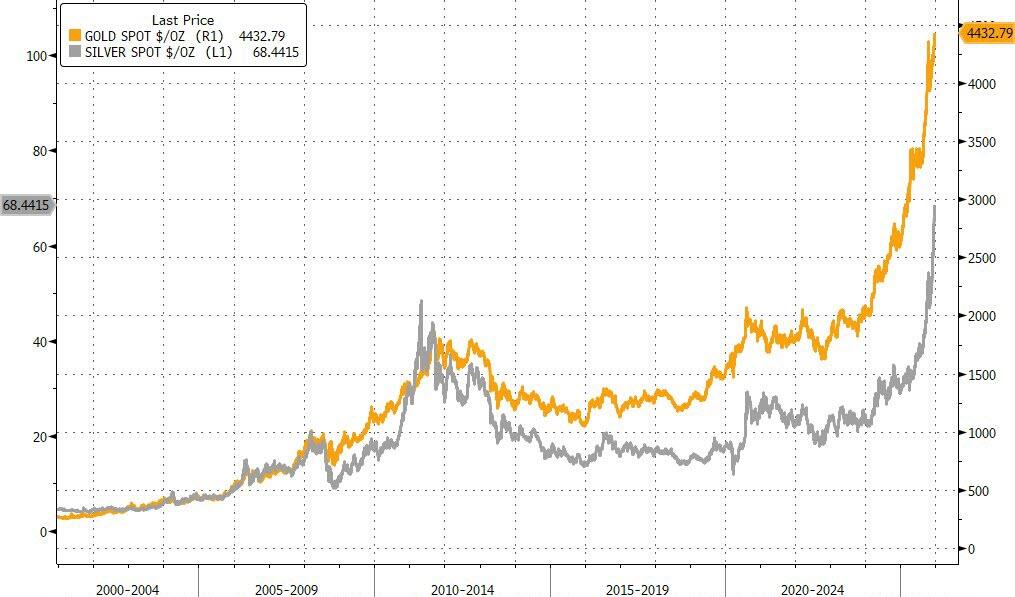
– Gold ETF up a “modest” 1.16% 

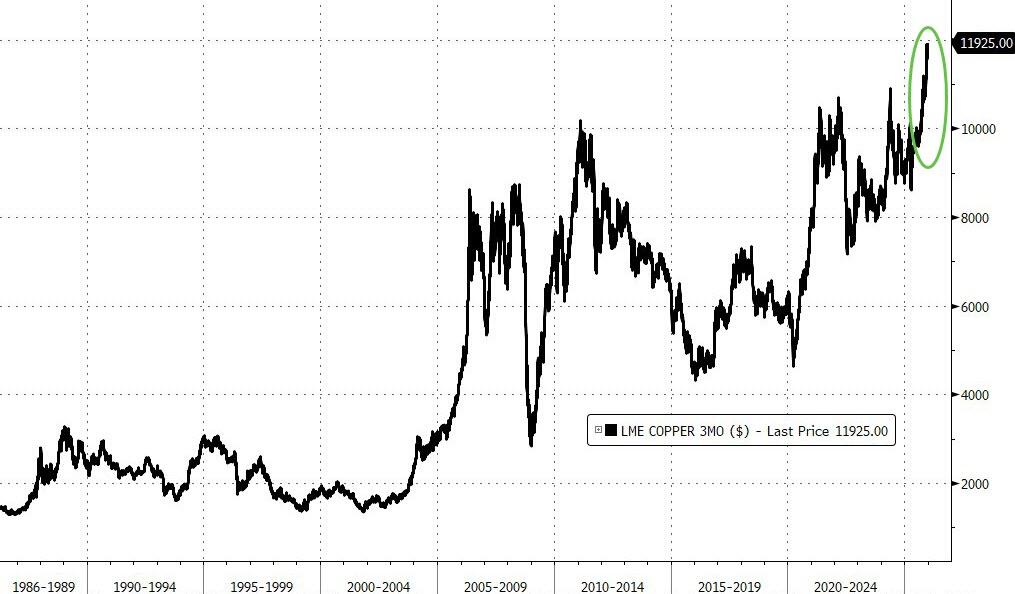
– Copper ripped +4.71% to a new record 

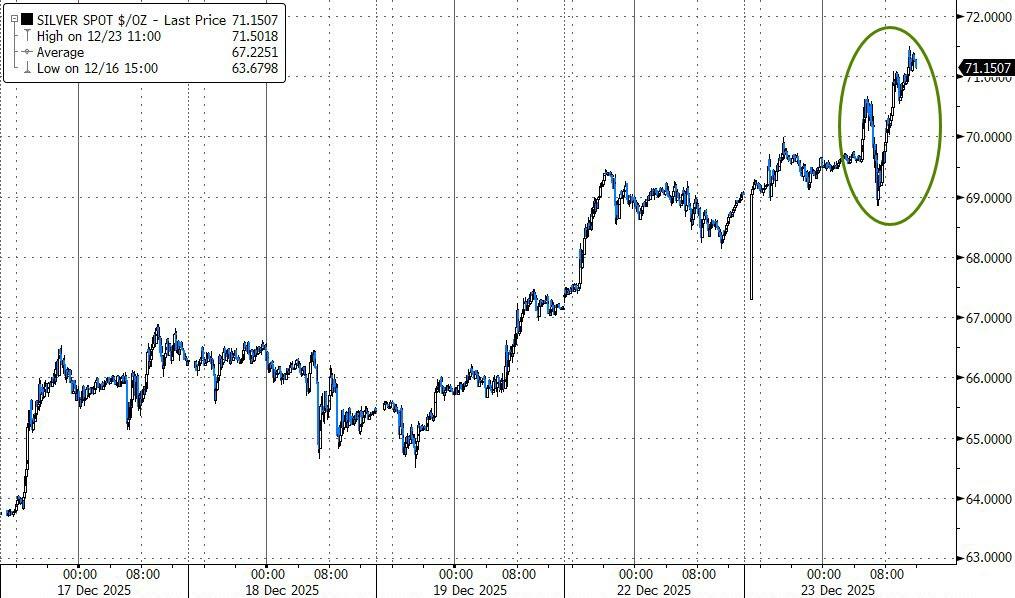
– Silver stole the show with a massive +9.05% surge—another all-time high 

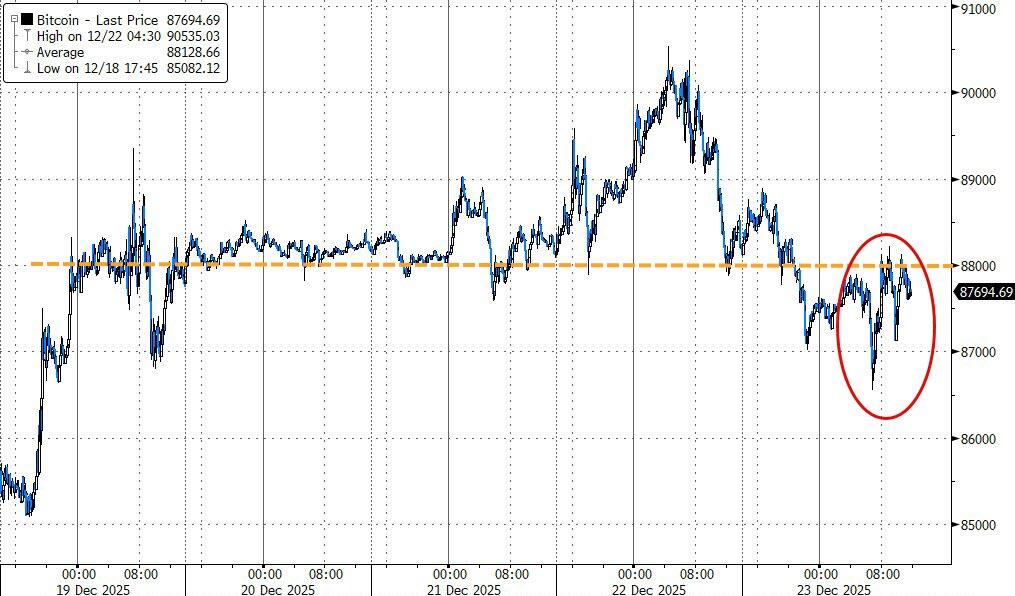
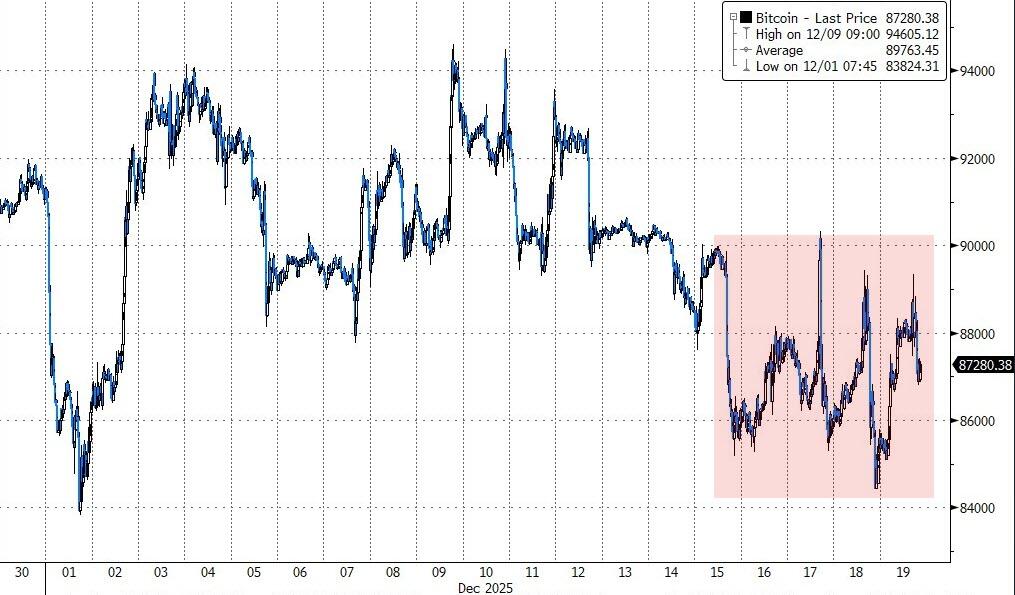
That combo gave our portfolios a nice lift even while stocks took a nap. Bitcoin did its usual pump-and-dump routine and ended the week around $87K.

Next week we wrap up December and 2025 with another four-day session (New Year’s Day off). Key data on deck: FOMC minutes, a bunch of housing reports, and Chicago PMI.

Read More
Nasdaq Leads Rebound, Metals Go Wild – Gold Nears $4,500

Ulli Market Commentary Contact

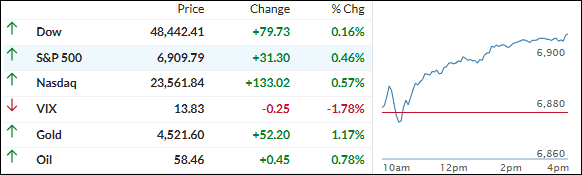
[Chart courtesy of MarketWatch.com]

  1. Moving the market

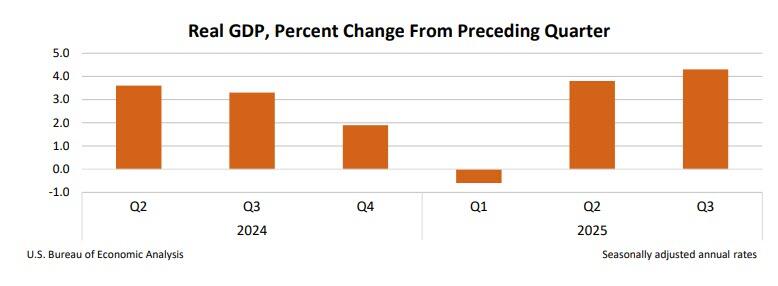
The day started a little wobbly—delayed Q3 GDP data finally dropped and came in hot at 4.3% (way above the 3.2% guess).

That had everyone pausing to wonder if the Fed might slow-walk those early-2026 rate cuts. Futures traders nudged up the odds of steady rates in January and March a touch, but they’re still betting on two cuts by year-end.

Early nerves turned into afternoon buying, though. The indexes shook off the slump, with the Nasdaq leading the charge. The S&P 500 hit a fresh record high, and all the majors locked in their fourth straight green day. Nice way to head into the holidays.

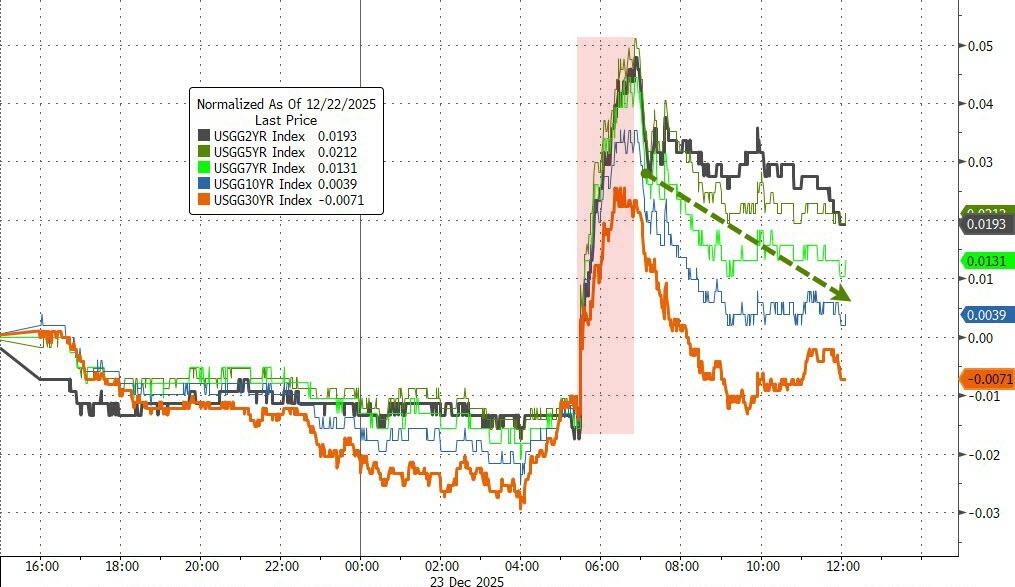
Bond yields crept higher (but backed off the peaks), the dollar sank to October lows, and that was rocket fuel for metals:

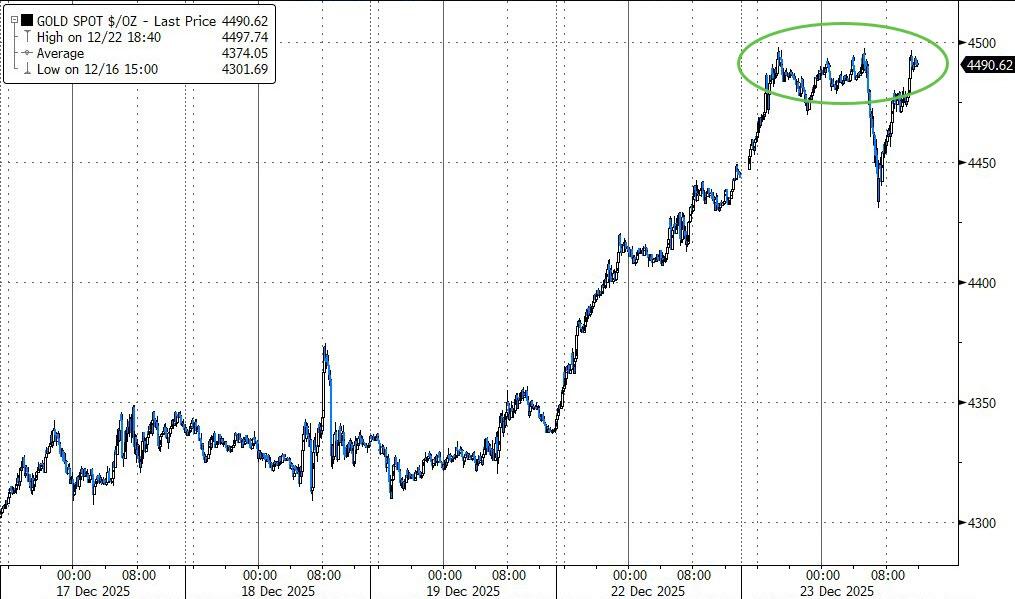
Gold got within a whisker of $4,500, silver blasted through $71 (though it stopped shy of $72), and copper punched another record high. Bitcoin lagged a bit and couldn’t crack $88K.

Uncertainty’s still hanging around—it’s just been shoved to the back burner while seasonal tailwinds take the wheel.

We’re enjoying the calm ride for now, but volatility’s always lurking in the shadows.

Read More

Dollar Slides, Gold & Silver Soar – Risk-On Vibes Return

Ulli Market Commentary Contact

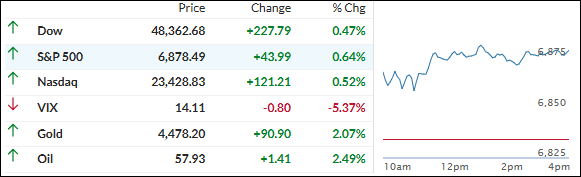
[Chart courtesy of MarketWatch.com]

  1. Moving the market

We started the day on a cheerful note, with the major indexes pushing higher right out of the gate—mostly thanks to tech and AI names getting their groove back.

Nvidia climbed over 1% on news they’re eyeing mid-February shipments of H200 chips to China. Micron and Oracle each added about 2%, giving the whole AI crew a nice lift after last week’s solid rebound.

Investors are still rotating into cheaper corners of the market (value, cyclicals) amid all the “are tech valuations too crazy?” chatter, so everyone’s watching to see if AI can hang onto leadership into year-end.

There’s been some doubt about a real Santa Claus rally kicking in—the S&P’s been flirting with a key technical level—but today eased a lot of those worries. Breadth was strong, and pretty much every asset class got in on the fun.

Even rising bond yields couldn’t spoil the mood (though they did knock the dollar lower all session).

That weakness was rocket fuel for precious metals: gold and silver both blasted to new record highs. Bitcoin started strong but gave it all back late and closed flat.

Quick question for you: when stocks grind higher, but metals are the ones smashing all-time highs, does it feel like pure risk-on harmony across the board… or a subtle sign some folks are quietly hedging just in case?

Read More

ETFs On The Cutline – Updated Through 12/19/2025

Ulli ETFs on the Cutline Contact

Do you want to know which ETFs are hot and which ones are not? Then you need my High-Volume ETF Cutline report. It tells you how close or far each of the 311 ETFs I follow is from its long-term trend line (39-week SMA). These are the ETFs that trade more than $5 million a day, so they are not some obscure funds that nobody cares about.

The report is split into two parts: The winners that are above their trend line (%M/A), and the losers that are below it. The yellow line is the line of shame that separates them. You can see how many ETFs are in each group and how they have changed since the last report (270 vs. 259 current).

Take a peek:

The HV ETF Master Cutline Report

If you are confused by some of the terms we use, don’t panic. I have a helpful Glossary of Terms for you.

If you want to learn more about the Cutline method and how it can make you rich (or at least less poor), read my original post here.

ETF Tracker Newsletter For December 19, 2025

Ulli ETF Tracker Contact

ETF Tracker StatSheet          

You can view the latest version here.

METALS HIT RECORDS; MAG 7 OUTPERFORMS – INGREDIENTS FOR UPSIDE ALIGN

[Chart courtesy of MarketWatch.com]

  1. Moving the market

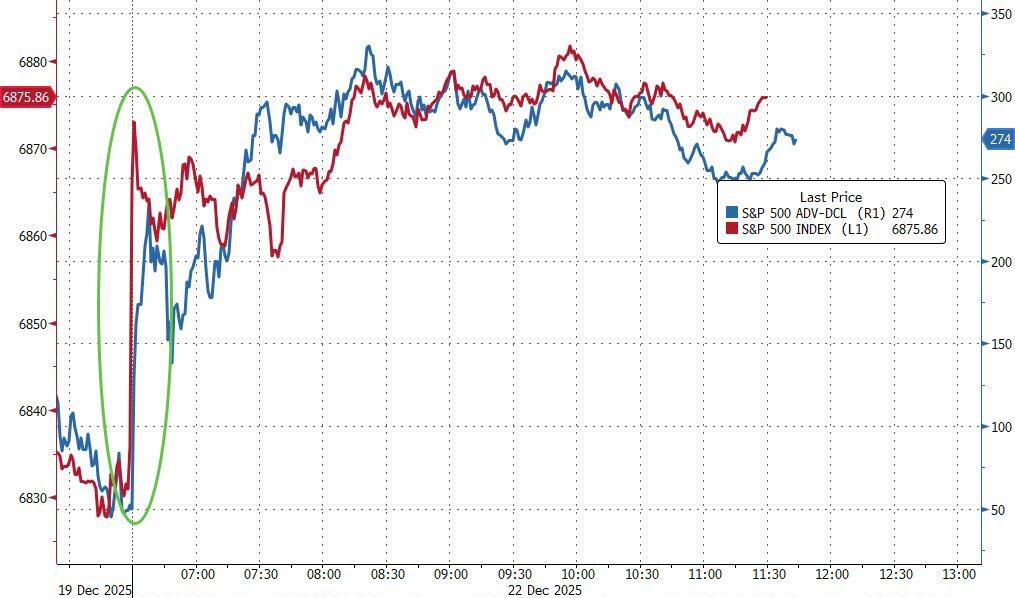
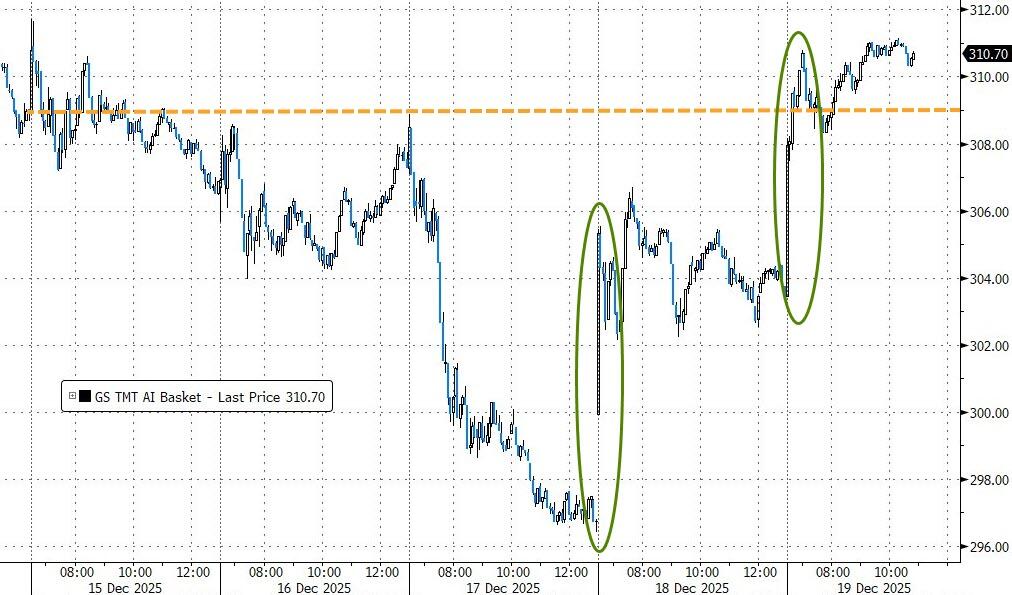
The market kicked off with a serious bang—major indexes rocketed higher early, led by the Nasdaq on a massive 7% pop in Oracle.

That helped breathe new life into the AI trade after a rough patch. Oracle had been in the doghouse this week after losing a key partner on a big data center project (which dragged down Broadcom, AMD, and others), but today’s surge flipped the script.

Nvidia added over 3% on reports the Trump admin is eyeing letting them sell advanced AI chips to China again (H200s to “approved customers”). Still, with valuations sky-high, folks are bracing for more chop into 2026—even if these are some of the strongest credits out there.

This week’s data painted a Goldilocks picture: tame inflation but enough economic softness to keep the Fed in play. Traders are now betting on cuts in March and June 2026, giving stocks more runway.

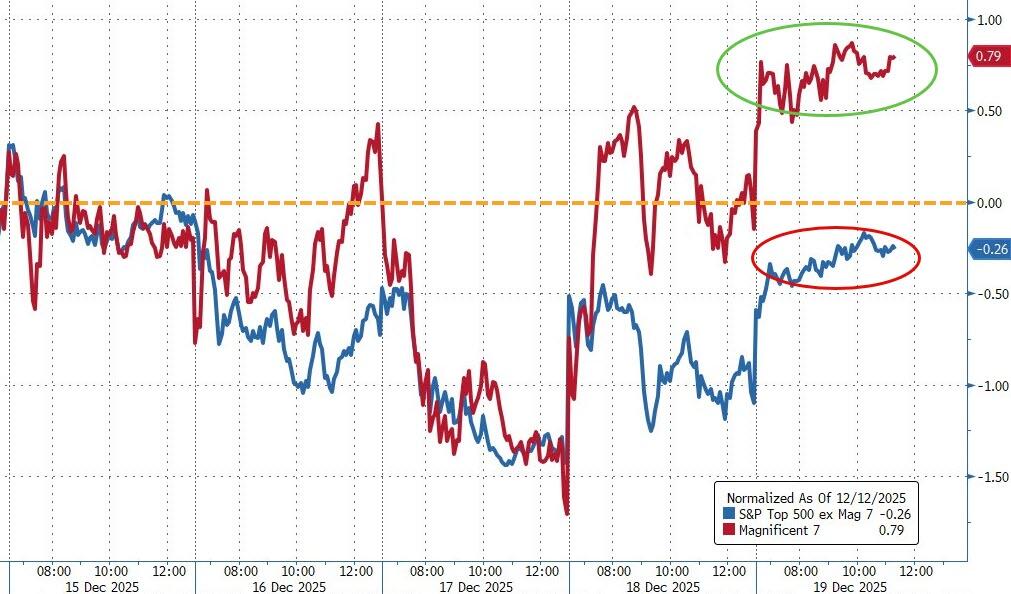
By Friday’s close, the S&P 500 clawed back to flat for the week, the Nasdaq squeezed out a modest gain, and the Mag 7 outperformed the other 493 S&P names—classic AI resurgence.

That monster options expiration passed without a hiccup.

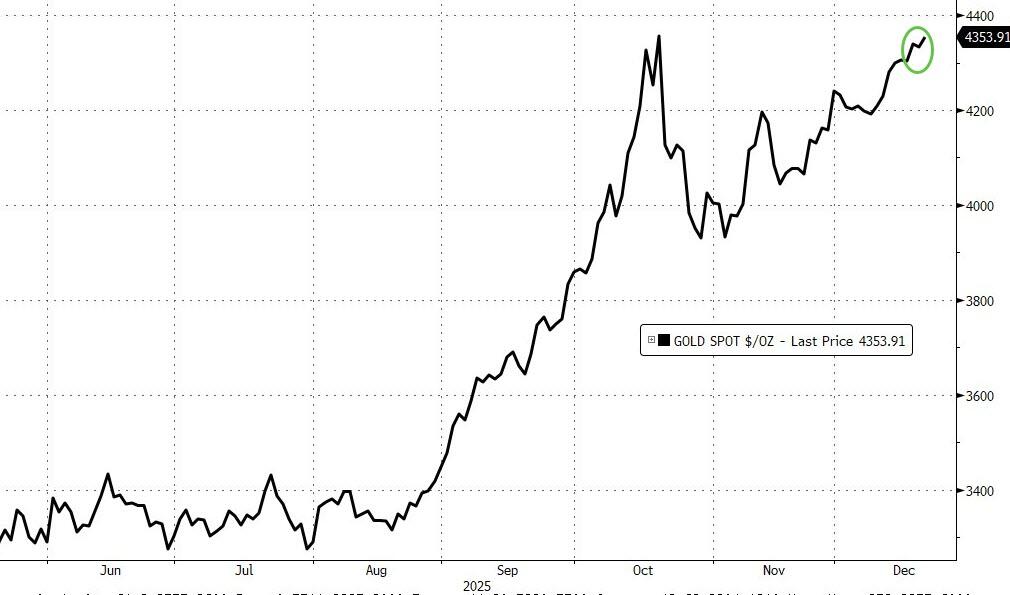
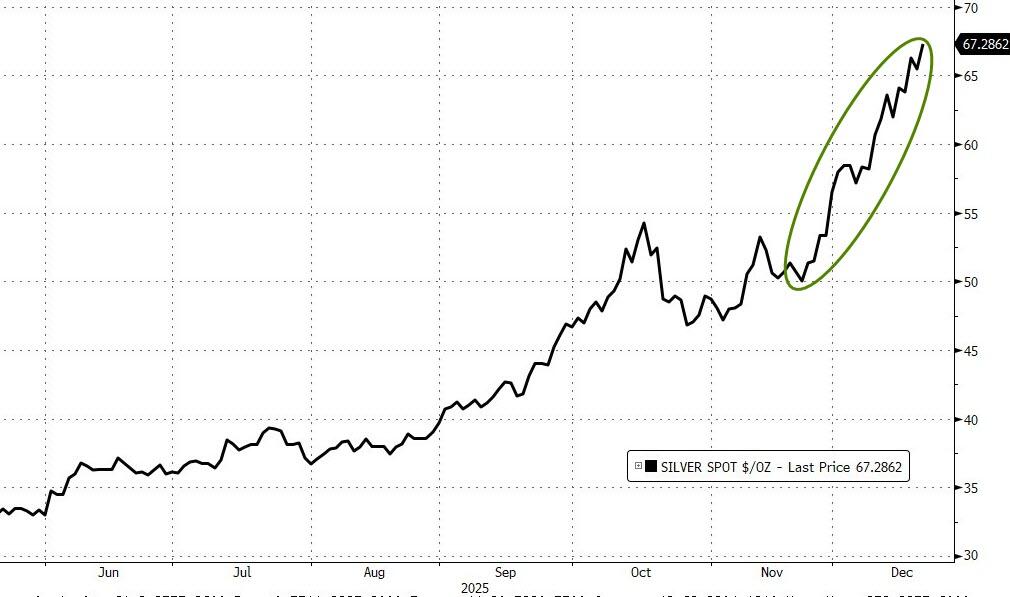
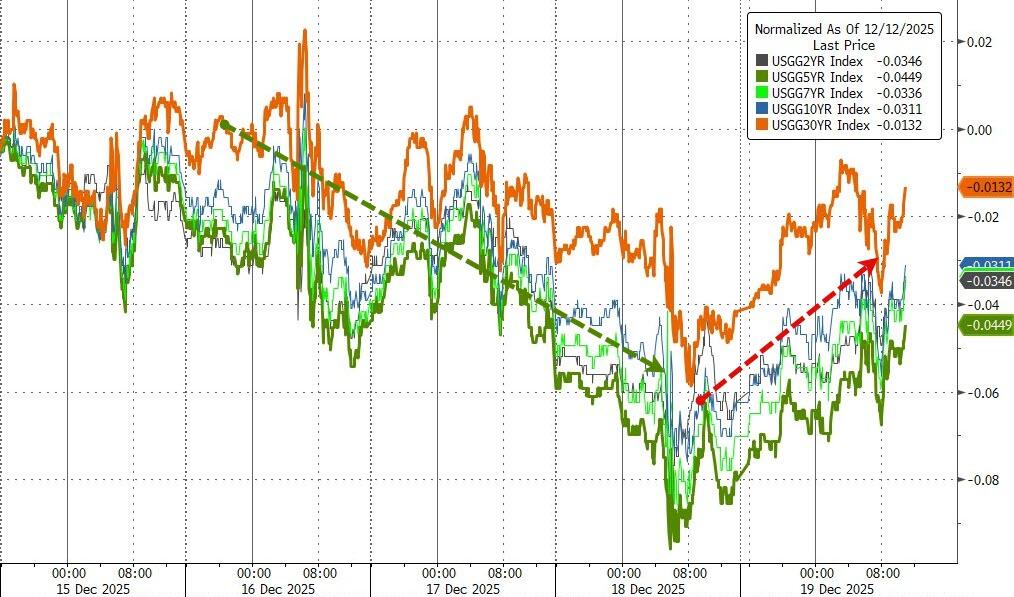
Metals stole the show: gold and silver both hit new record closes (gold over $4,350, silver topping $67), while copper flirted with old highs. Bond yields eased; Bitcoin rode its usual rollercoaster to finish slightly lower.

Big picture: fiscal stimulus is kicking in, money’s getting looser, political noise is fading, and seasonality’s on our side. The road might zig-zag, but the setup for upside into year-end looks solid.

Read More

Weekly StatSheet For The ETF Tracker Newsletter – Updated Through 12/18/2025

Ulli ETF StatSheet Contact

ETF Data updated through Thursday, December 18, 2025

How to use this StatSheet:

  1. Out of the 1,800+ ETFs out there, I only pick the ones that trade over $5 million per day (HV ETFs), so you don’t get stuck with a lemon that nobody wants to buy or sell.
  1. Trend Tracking Indexes (TTIs)

These are the main indicators that tell you when to buy or sell Domestic and International ETFs (section 1 and 2). They do that by comparing their position to their long-term M/A (Moving Average). If they cross above, and stay there, it’s a green light to buy. If they fall below, and keep going, it’s a red light to sell. And to make sure you don’t lose your shirt if things go south, I also use a 12% trailing stop loss on all positions in these categories.

  1. All other investment areas don’t have a TTI and should be traded based on the position of each ETF relative to its own trend line (%M/A). That’s why I call them “Selective Buy.” In other words, if an ETF goes above its own trend line, you can buy it. But don’t forget to use a trailing sell stop of 12%, or less if you’re feeling nervous.

If some of these words sound like Greek to you, please check out the Glossary of Terms and new subscriber information in section 9.

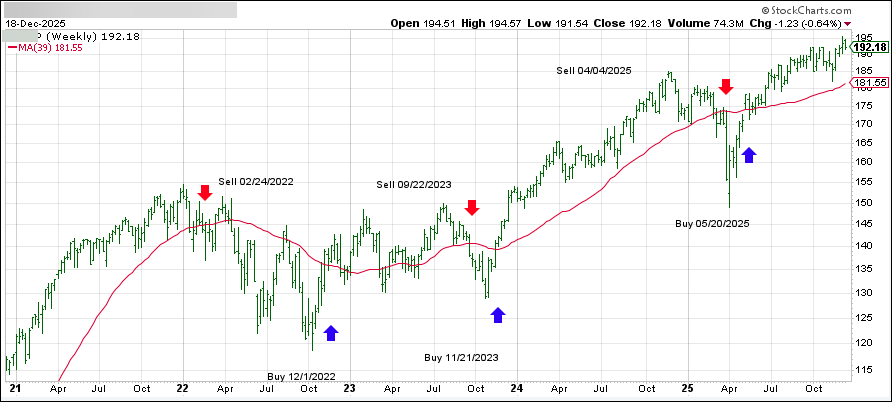
  1. DOMESTIC EQUITY ETFs: BUY— effective 5/20/2025

Click on chart to enlarge

This is our main compass, the Domestic Trend Tracking Index (TTI-green line in the above chart). It has broken above its long-term trend line (red) by +6.17% and remains in “Buy” mode, with our holdings being subject to our trailing sell stops.

Read More