
- Moving the Markets
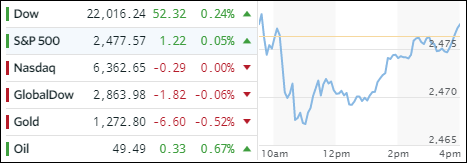
Thanks to an assist from Apple’s (AAPL) almost 5% gain on blow-out earnings, the Dow managed to conquer the much anticipated 22,000 level for the first time, which makes it its third 1,000-point milestone of the year. The close above 22k was the seventh fastest milestone move, with the last one having occurred in March (21k). The other credit goes to Boeing with its 53% YTD gain, which made it the best performer in the index.
Other news were not exactly awe inspiring with ADP’s weaker than expected jobs data, as manufacturing lost the most jobs since the election. Then there were escalating tensions with Russia, and China and India engaged in the latest face-off.
While there was quite some exuberance in Apple shares, most stocks were drifting with SmallCaps (SCHA) sinking -0.94% followed by MidCaps (SCHM) with -0.49%. The Transportation Average (IYT) managed to buck the trend with +0.28% and the Aerospace and Defense ETF (ITA) added +0.53%. Other than that, the overriding theme was “listless” with the S&P 500 not having gained 1% or more in a single day for 69 straight sessions, the longest streak since March 2007, according to ZH.
Interest rates rose with the yield on the 10-year bond inching up 1 basis point to 2.31%. The US dollar (UUP) had an interesting day in that it tested a new 27-month low but managed to rebound to a loss of only -0.12%.
- ETFs in the Spotlight (updated for 2017)
In case you missed the announcement and description of this section, you can read it here again.
It features 10 broadly diversified and sector ETFs from my HighVolume list as posted every Saturday. Furthermore, they are screened for the lowest MaxDD% number meaning they have been showing better resistance to temporary sell offs than all others over the past year.
The below table simply demonstrates the magnitude with which some of the ETFs are fluctuating in regards to their positions above or below their respective individual trend lines (%M/A). A break below, represented by a negative number, shows weakness, while a break above, represented by a positive percentage, shows strength.
For hundreds of ETF choices, be sure to reference Thursday’s StatSheet.
Year to date, here’s how the 2017 candidates have fared so far:
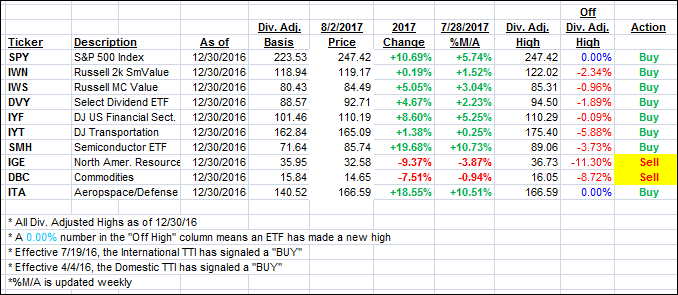
Again, the %M/A column above shows the position of the various ETFs in relation to their respective long term trend lines, while the trailing sell stops are being tracked in the “Off High” column. The “Action” column will signal a “Sell” once the -7.5% point has been taken out in the “Off High” column.
- Trend Tracking Indexes (TTIs)
Our Trend Tracking Indexes (TTIs) barely changed as the major indexes predominantly drifted.
Here’s how we closed 8/2/2017:
Domestic TTI: +3.25% (last close +3.28%)—Buy signal effective 4/4/2016
International TTI: +8.33% (last close +8.40%)—Buy signal effective 7/19/2016
Disclosure: I am obliged to inform you that I, as well as my advisory clients, own some of the ETFs listed in the above table. Furthermore, they do not represent a specific investment recommendation for you, they merely show which ETFs from the universe I track are falling within the guidelines specified.
Contact Ulli