Market Rally Defies Hedge Fund Pessimism, Inflation Fears, And China Slump

Ulli Market Commentary Contact

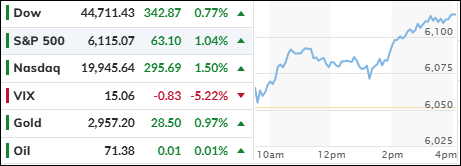
[Chart courtesy of MarketWatch.com]

  1. Moving the markets 

The stock market reached new heights today, following up on Friday’s record-breaking rally. The Dow breached the 38,000 mark for the first time ever, gaining 145 points or 0.4%. The S&P 500 also rose 0.4%, hitting another all-time high.

But not everyone is buying the bull run. Hedge funds have been betting heavily against stocks, with shorts outnumbering longs 2:1 this week and 3:1 this year. Are they in for a rude awakening?

The fate of Wall Street may hinge on the Fed’s ability to land the economy softly, easing inflation without triggering a recession. The odds of a Fed rate cut in March have dropped sharply, from 81% to 40%, in the past week. Meanwhile, the probability of no change has jumped from 19% to 58%.

Traders will be eyeing several key economic indicators this week, such as the fourth quarter GDP on Thursday and the Fed’s preferred inflation gauge, the PCE price index, on Friday. These reports will influence how the Fed shapes its monetary policy going forward.

The market got a boost today from falling bond yields, which signaled weak economic growth, but this was offset by rising oil prices, as tensions in the Middle East flared up again.

US stocks were mixed, with small caps surging at the open but fading later, while the large caps held on to modest gains. China’s market, however, tanked overnight.

Ultimately, it’s still a game of a few big players, whose momentum has been impressive. This is evident from the fact that the S&P 500, weighted by market cap, climbed steadily in January, while the equal-weighted version has fallen. This is a divergence that began a few weeks ago.

How long can it go on?

Read More

ETFs On The Cutline – Updated Through 01/19/2024

Ulli ETFs on the Cutline Contact

Do you want to know which ETFs are hot and which ones are not? Then you need my High-Volume ETF Cutline report. It tells you how close or far each of the 311 ETFs I follow is from its long-term trend line (39-week SMA). These are the ETFs that trade more than $5 million a day, so they are not some obscure funds that nobody cares about.

The report is split into two parts: The winners that are above their trend line (%M/A), and the losers that are below it. The yellow line is the line of shame that separates them. You can see how many ETFs are in each group and how they have changed since the last report (261 vs. 244 current).

Take a peek:

The HV ETF Master Cutline Report

If you are confused by some of the terms we use, don’t panic. I have a helpful Glossary of Terms for you.

If you want to learn more about the Cutline method and how it can make you rich (or at least less poor), read my original post here.

ETF Tracker Newsletter For January 19, 2024

Ulli ETF Tracker Contact

ETF Tracker StatSheet          

You can view the latest version here.

HOW LONG CAN THE S&P 500 AND BOND YIELDS STAY OUT OF SYNC?

[Chart courtesy of MarketWatch.com]

  1. Moving the markets 

The markets shrugged off their early-year jitters and resumed their upward march today, lifting the S&P 500 to a fresh record high.

Wall Street was boosted by a tech rally, sparked by a glowing endorsement of Apple from Bank of America. The iPhone maker soared to its best day since May 5, 2023, helping the S&P 500 and Nasdaq wipe out their 2024 losses.

The S&P 500 had a remarkable comeback in 2023, surging 24% after a dismal 2022 that saw it plunge 19%.

The economy defied the recession fears, and inflation eased enough to let the Fed take a break from hiking rates. The index finally broke into new territory today, thanks to wide-spread optimism.

But the party could be short-lived if the Fed fails to land the economy softly in 2024. If the growth momentum falters, the new highs could be hard to sustain, let alone be surpassed.

For now, traders are celebrating the new record, and the Mag7 stocks are joining the fun with their own stellar performances.

But there’s a dark cloud looming over the market: bond yields. They have been rising steadily all week, while the major indexes have been ignoring them. This chart shows how out of sync they are.

This can’t last forever, so something has to give. Will the S&P 500 fall back to earth, or will bond yields drop to catch up with the index?

Read More

Weekly StatSheet For The ETF Tracker Newsletter – Updated Through 01/18/2024

Ulli ETF StatSheet Contact

ETF Data updated through Thursday, January 18, 2024

How to use this StatSheet:

  1. Out of the 1,800+ ETFs out there, I only pick the ones that trade over $5 million per day (HV ETFs), so you don’t get stuck with a lemon that nobody wants to buy or sell.
  1. Trend Tracking Indexes (TTIs)

These are the main indicators that tell you when to buy or sell Domestic and International ETFs (section 1 and 2). They do that by comparing their position to their long-term M/A (Moving Average). If they cross above, and stay there, it’s a green light to buy. If they fall below, and keep going, it’s a red light to sell. And to make sure you don’t lose your shirt if things go south, I also use a 12% trailing stop loss on all positions in these categories.

  1. All other investment areas don’t have a TTI and should be traded based on the position of each ETF relative to its own trend line (%M/A). That’s why I call them “Selective Buy.” In other words, if an ETF goes above its own trend line, you can buy it. But don’t forget to use a trailing sell stop of 12%, or less if you’re feeling nervous.

If some of these words sound like Greek to you, please check out the Glossary of Terms and new subscriber information in section 9.

  1. DOMESTIC EQUITY ETFs: BUY— since 11/21/2023

Click on chart to enlarge

This is our main compass, the Domestic Trend Tracking Index (TTI-green line in the above chart). It has broken above its long-term trend line (red) by +5.85% and is in “Buy” mode as posted.

Read More

Apple Shines, But Market Faces Alligator Risk

Ulli Market Commentary Contact

[Chart courtesy of MarketWatch.com]

  1. Moving the markets 

The market was in a good mood today, thanks to the tech sector’s strong performance. Apple led the way, gaining 3.3% after getting a thumbs up from Bank of America. The iPhone maker shrugged off a recent downgrade from Wells Fargo and had its best day in over eight months.

Meanwhile, the job market remained tight, as the latest data showed fewer people filing for unemployment benefits than expected. The 10-year Treasury yield rose to 4.14%, reflecting the economic optimism.

However, not everyone was happy. The Fed’s Raphael Bostic said he expects the central bank to start cutting rates in the third quarter, which is sooner than he previously thought, but slower than what the market wants.

The Senate also did its part, passing a bill to avoid a government shutdown. This sparked a buying frenzy in stocks, especially on the Nasdaq, which outperformed the other indexes. The MAG7 stocks (Microsoft, Amazon, Google, Facebook, Netflix, Tesla, and Apple) reached new heights, while the most hated stocks continued to suffer.

Other markets also saw some action. Bond yields climbed higher, the dollar stayed flat, oil prices rose over 2%, and gold bounced back from the $2k level.

But here’s the catch. The S&P 500 and bond yields are both at one-month highs, which is a rare and risky situation. It looks like an alligator’s mouth that could snap at any moment.

Will the market bite the bullet or dodge the bullet?

Read More

Fed In A Bind: Cut Rates And Risk Inflation, Or Hold Rates And Anger The Market?

Ulli Market Commentary Contact

[Chart courtesy of MarketWatch.com]

  1. Moving the markets 

The stock market lost its appetite as bond prices went down and interest rates went up. The U.S. economy also showed some surprising strength, making the Fed less likely to cut rates.

ZeroHedge summed it up like this: Retail sales: hot; Housing: sizzling; Industrial Production: – not bad. The ‘real’ numbers are looking good, while the ‘soft’ surveys are tanking. Bottom line: the economy is growing too fast for the Fed to lower rates, and the market knows it.

But traders are still hoping for a miracle, and betting on a 52% chance that the Fed will start cutting rates in March.

The December retail sales report was a big boost for the economy, and a big blow for the rate-cutters. Consumers were spending like crazy, even without cars.

Retail sales rose 0.6% from November and 0.4% without autos. Economists were expecting 0.4% and 0.2%, respectively. The 10-year Treasury yield jumped to 4.11%, up 4 basis points from Tuesday, after Fed Governor Waller said the Fed might not ease as fast as the market wants.

The MAG7 stocks (Microsoft, Apple, Google, Amazon, Facebook, Netflix, and Tesla) had a bad day, losing all their gains for the year. The most hated stocks also kept falling, with no sign of a rebound.

The dollar was the big winner, thanks to the higher yields. It had the best start to a year since 2015. Gold, on the other hand, suffered from the stronger dollar, and ended the day lower.

The Fed’s next move will be crucial for the market’s direction. The Fed is in a tough spot. If Powell gives the market what it wants (6 rate cuts) in this election year, inflation will go through the roof, and everyone will be mad, especially the politicians who want to keep their jobs. If he doesn’t cut, the market will be sad, and only the bears will be happy.

What will he do?

Read More