
- Moving the markets
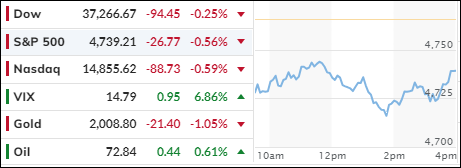
The stock market lost its appetite as bond prices went down and interest rates went up. The U.S. economy also showed some surprising strength, making the Fed less likely to cut rates.
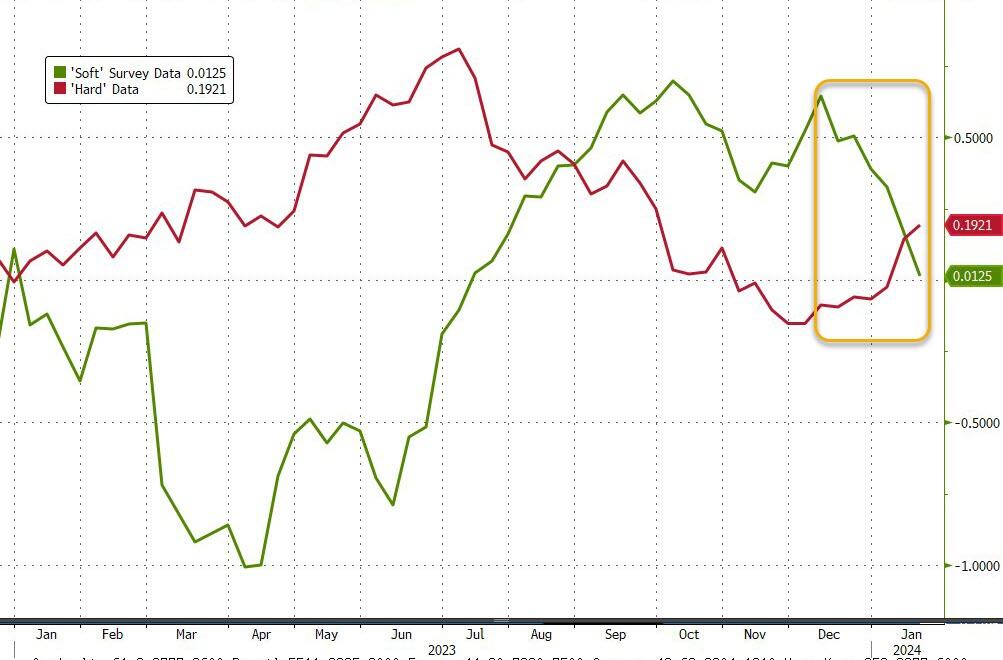
ZeroHedge summed it up like this: Retail sales: hot; Housing: sizzling; Industrial Production: – not bad. The ‘real’ numbers are looking good, while the ‘soft’ surveys are tanking. Bottom line: the economy is growing too fast for the Fed to lower rates, and the market knows it.
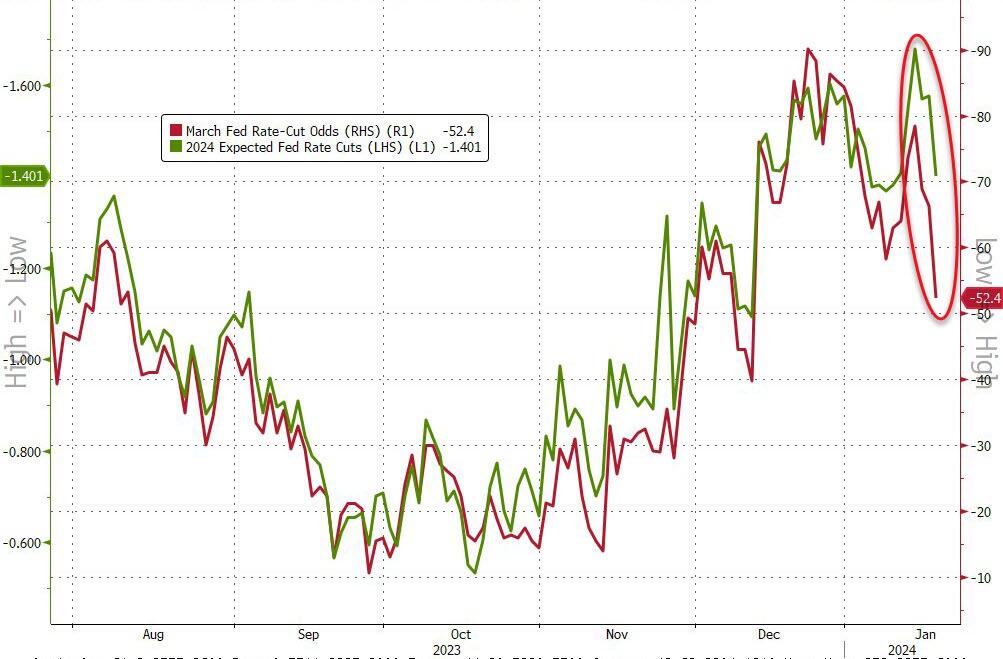
But traders are still hoping for a miracle, and betting on a 52% chance that the Fed will start cutting rates in March.
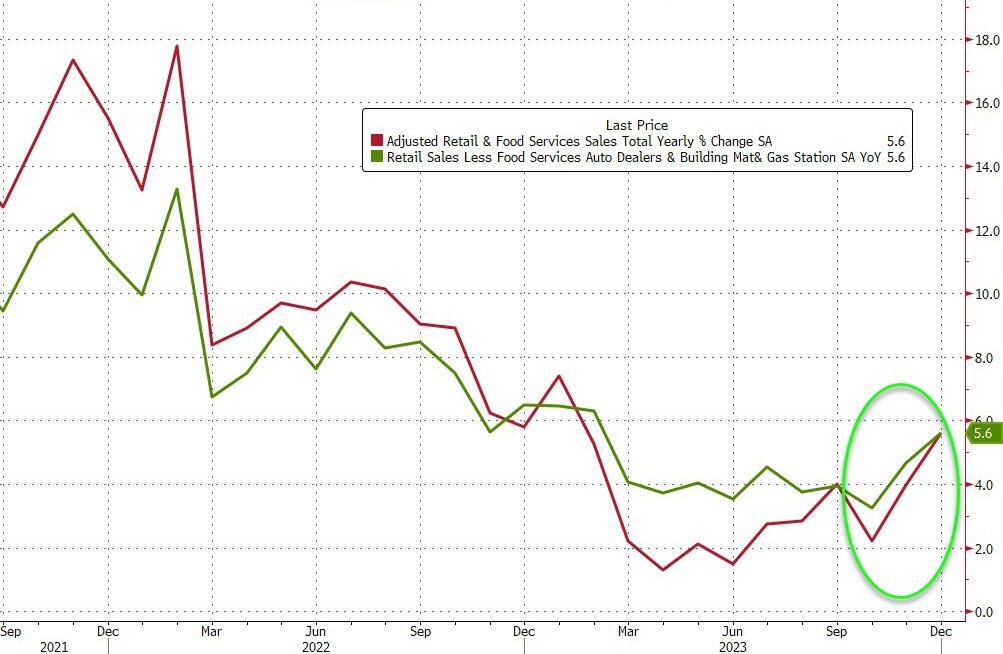
The December retail sales report was a big boost for the economy, and a big blow for the rate-cutters. Consumers were spending like crazy, even without cars.
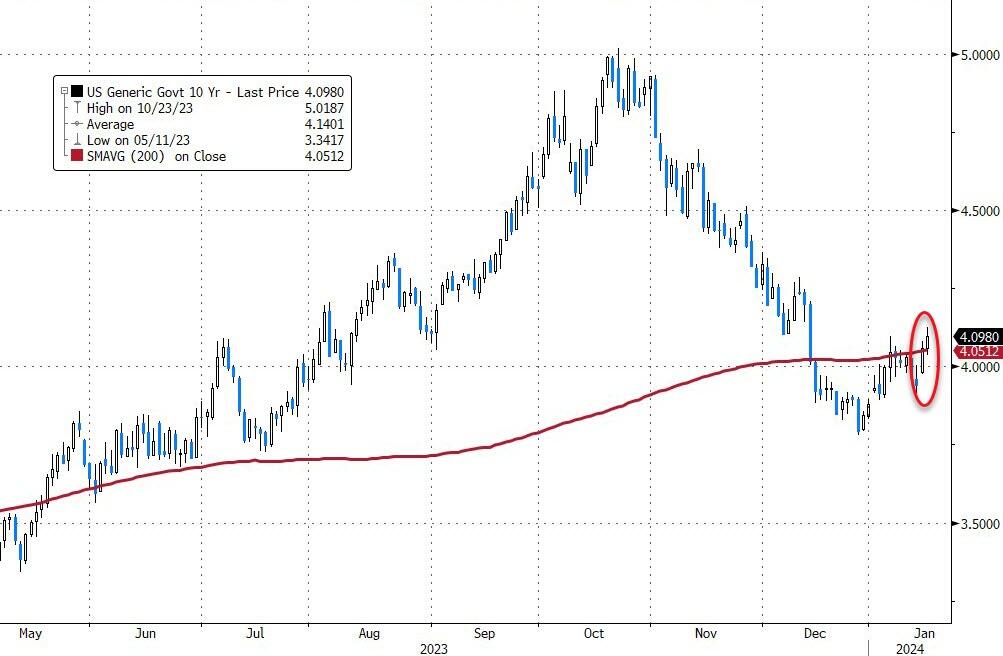
Retail sales rose 0.6% from November and 0.4% without autos. Economists were expecting 0.4% and 0.2%, respectively. The 10-year Treasury yield jumped to 4.11%, up 4 basis points from Tuesday, after Fed Governor Waller said the Fed might not ease as fast as the market wants.
The MAG7 stocks (Microsoft, Apple, Google, Amazon, Facebook, Netflix, and Tesla) had a bad day, losing all their gains for the year. The most hated stocks also kept falling, with no sign of a rebound.
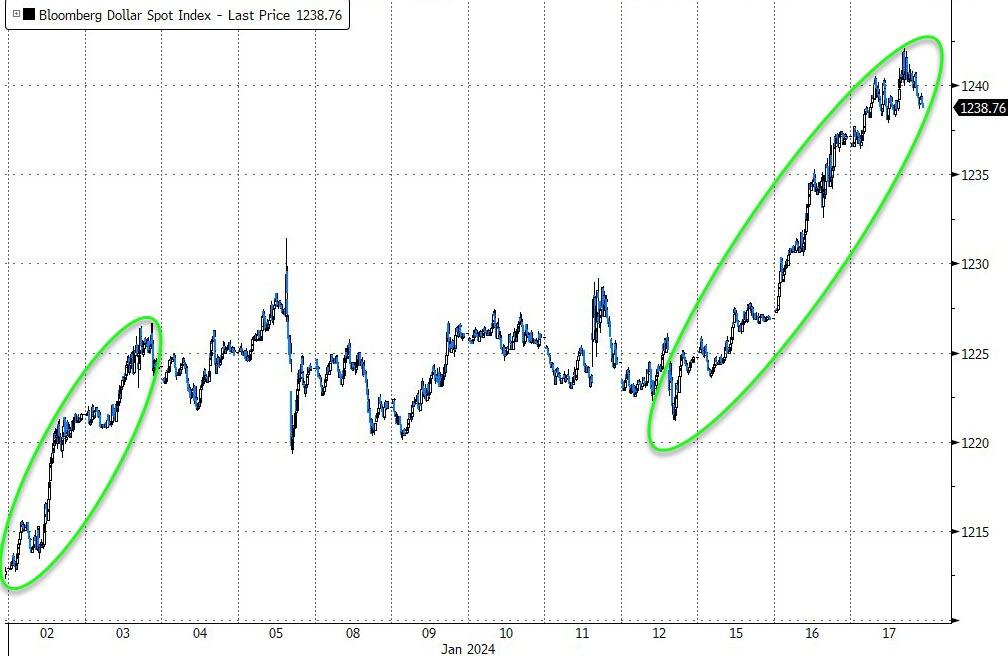
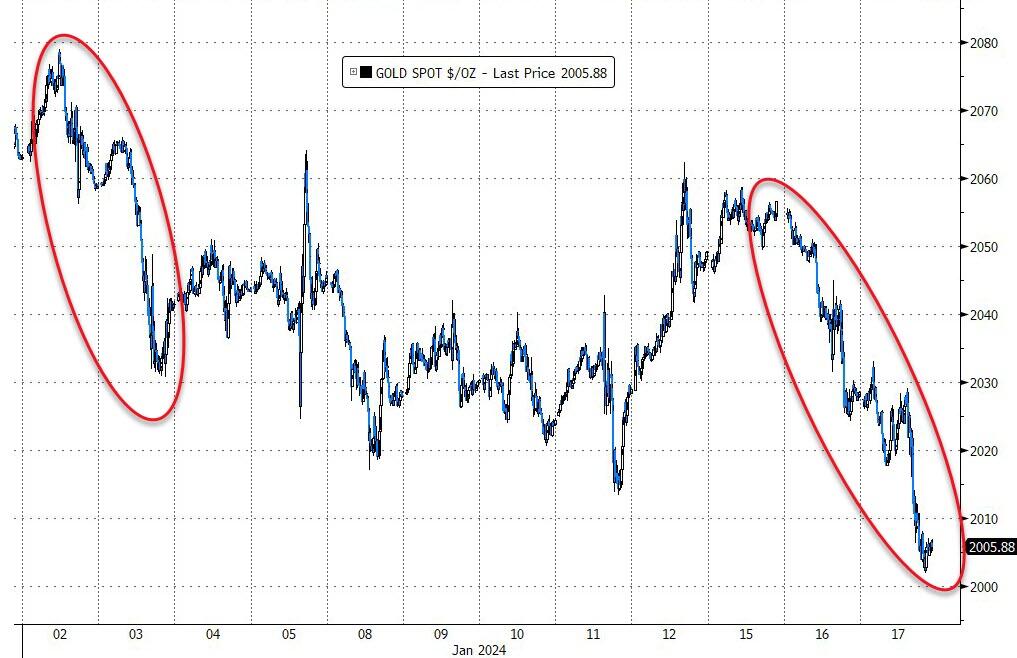
The dollar was the big winner, thanks to the higher yields. It had the best start to a year since 2015. Gold, on the other hand, suffered from the stronger dollar, and ended the day lower.
The Fed’s next move will be crucial for the market’s direction. The Fed is in a tough spot. If Powell gives the market what it wants (6 rate cuts) in this election year, inflation will go through the roof, and everyone will be mad, especially the politicians who want to keep their jobs. If he doesn’t cut, the market will be sad, and only the bears will be happy.
What will he do?
2. Current “Buy” Cycles (effective 11/21/2023)
Our Trend Tracking Indexes (TTIs) have both crossed their trend lines with enough strength to trigger new “Buy” signals. That means, Tuesday, 11/21/2023, was the official date for these signals.
If you want to follow our strategy, you should first decide how much you want to invest based on your risk tolerance (percentage of allocation). Then, you should check my Thursday StatSheet and Saturday’s “ETFs on the Cutline” report for suitable ETFs to buy.
3. Trend Tracking Indexes (TTIs)
The same trend went on: as bond prices fell and interest rates went up, the stock market and gold prices dropped too. The dollar became stronger because of this.
Our TTIs also retreated, but they are still in the “buy” zone.
This is how we closed 1/17/2024:
Domestic TTI: +5.30% above its M/A (prior close +6.14%)—Buy signal effective 11/21/2023.
International TTI: +4.58% above its M/A (prior close +5.32%)—Buy signal effective 11/21/2023.
All linked charts above are courtesy of Bloomberg via ZeroHedge.
———————————————————-
WOULD YOU LIKE TO HAVE YOUR INVESTMENTS PROFESSIONALLY MANAGED?
Do you have the time to follow our investment plans yourself? If you are a busy professional who would like to have his portfolio managed using our methodology, please contact me directly to get more details.
—————————————————————-
Contact Ulli