
ETF Tracker StatSheet
You can view the latest version here.
HOW LONG CAN THE S&P 500 AND BOND YIELDS STAY OUT OF SYNC?
- Moving the markets
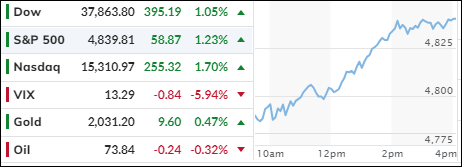
The markets shrugged off their early-year jitters and resumed their upward march today, lifting the S&P 500 to a fresh record high.
Wall Street was boosted by a tech rally, sparked by a glowing endorsement of Apple from Bank of America. The iPhone maker soared to its best day since May 5, 2023, helping the S&P 500 and Nasdaq wipe out their 2024 losses.
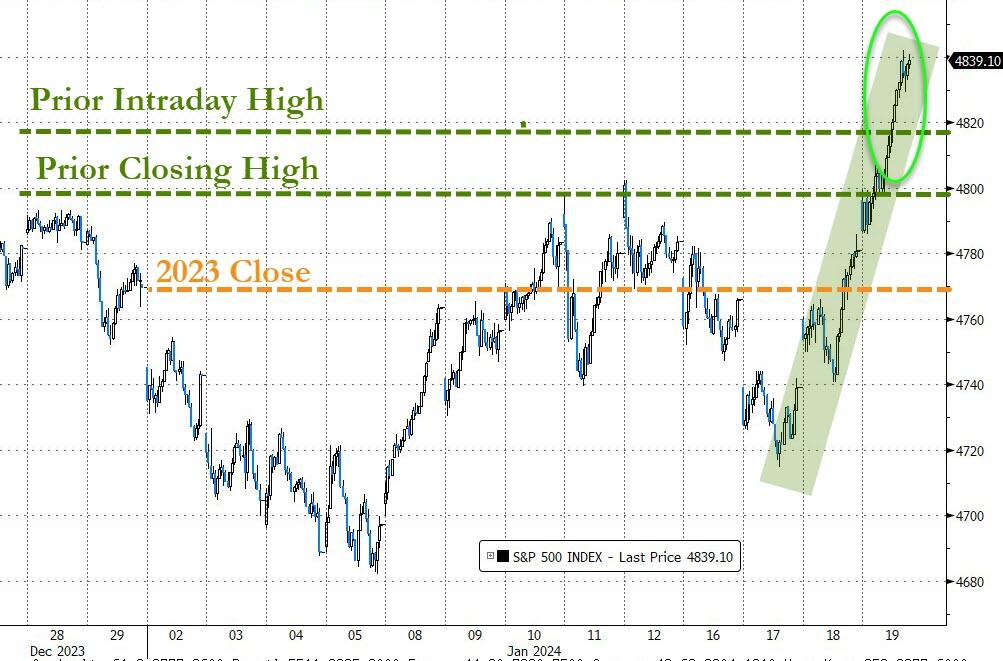
The S&P 500 had a remarkable comeback in 2023, surging 24% after a dismal 2022 that saw it plunge 19%.
The economy defied the recession fears, and inflation eased enough to let the Fed take a break from hiking rates. The index finally broke into new territory today, thanks to wide-spread optimism.
But the party could be short-lived if the Fed fails to land the economy softly in 2024. If the growth momentum falters, the new highs could be hard to sustain, let alone be surpassed.
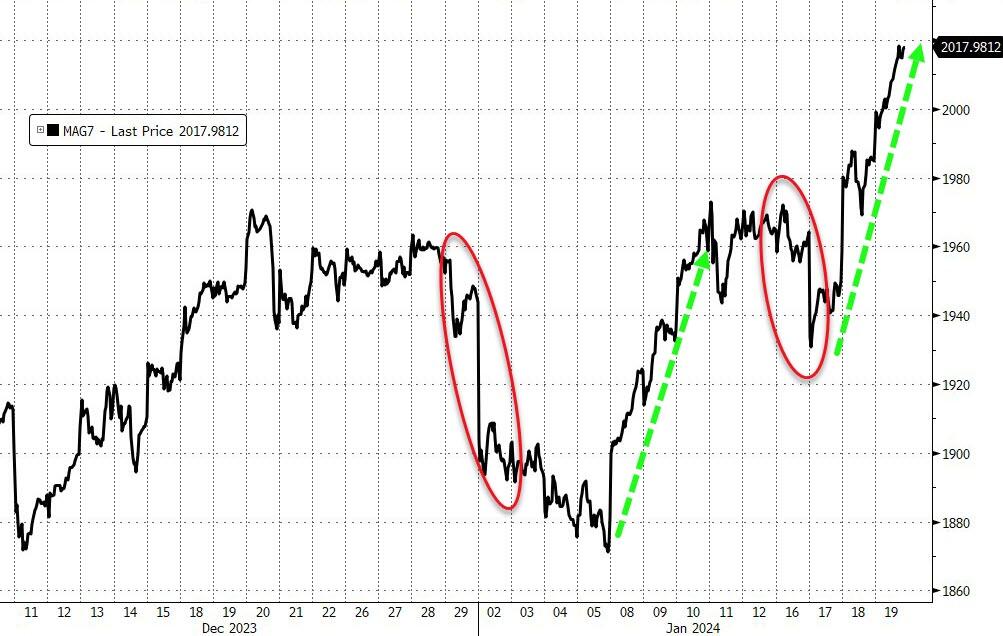
For now, traders are celebrating the new record, and the Mag7 stocks are joining the fun with their own stellar performances.
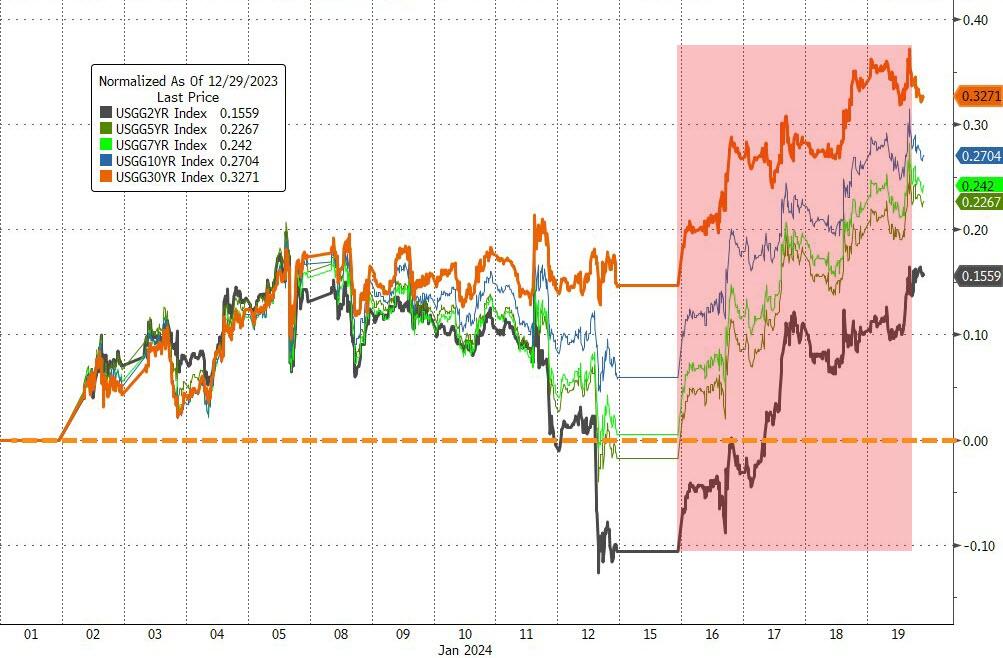
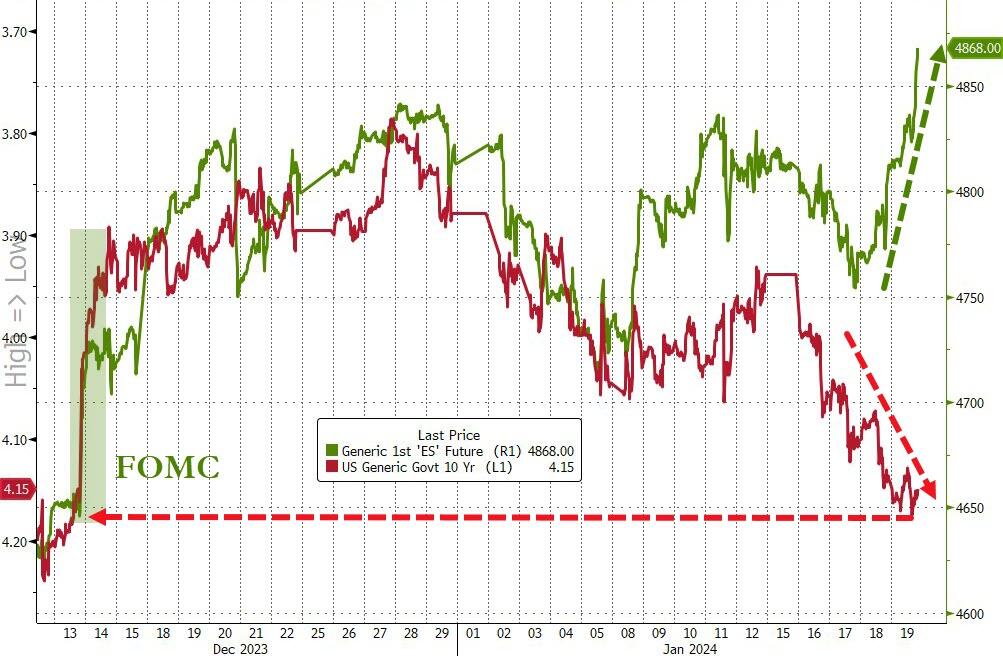
But there’s a dark cloud looming over the market: bond yields. They have been rising steadily all week, while the major indexes have been ignoring them. This chart shows how out of sync they are.
This can’t last forever, so something has to give. Will the S&P 500 fall back to earth, or will bond yields drop to catch up with the index?
2. Current “Buy” Cycles (effective 11/21/2023)
Our Trend Tracking Indexes (TTIs) have both crossed their trend lines with enough strength to trigger new “Buy” signals. That means, Tuesday, 11/21/2023, was the official date for these signals.
If you want to follow our strategy, you should first decide how much you want to invest based on your risk tolerance (percentage of allocation). Then, you should check my Thursday StatSheet and Saturday’s “ETFs on the Cutline” report for suitable ETFs to buy.
3. Trend Tracking Indexes (TTIs)
The markets were very optimistic today, as traders had enough confidence and momentum to make the S&P 500 reach a new high.
Our Trend Tracking Indexes (TTIs) also showed strong growth and moved further away from their trend lines, indicating a more bullish market.
This is how we closed 1/19/2024:
Domestic TTI: +6.43% above its M/A (prior close +5.85%)—Buy signal effective 11/21/2023.
International TTI: +5.64% above its M/A (prior close +5.11%)—Buy signal effective 11/21/2023.
All linked charts above are courtesy of Bloomberg via ZeroHedge.
———————————————————-
WOULD YOU LIKE TO HAVE YOUR INVESTMENTS PROFESSIONALLY MANAGED?
Do you have the time to follow our investment plans yourself? If you are a busy professional who would like to have his portfolio managed using our methodology, please contact me directly to get more details.
—————————————————————-
Contact Ulli