
ETF Tracker StatSheet
You can view the latest version here.
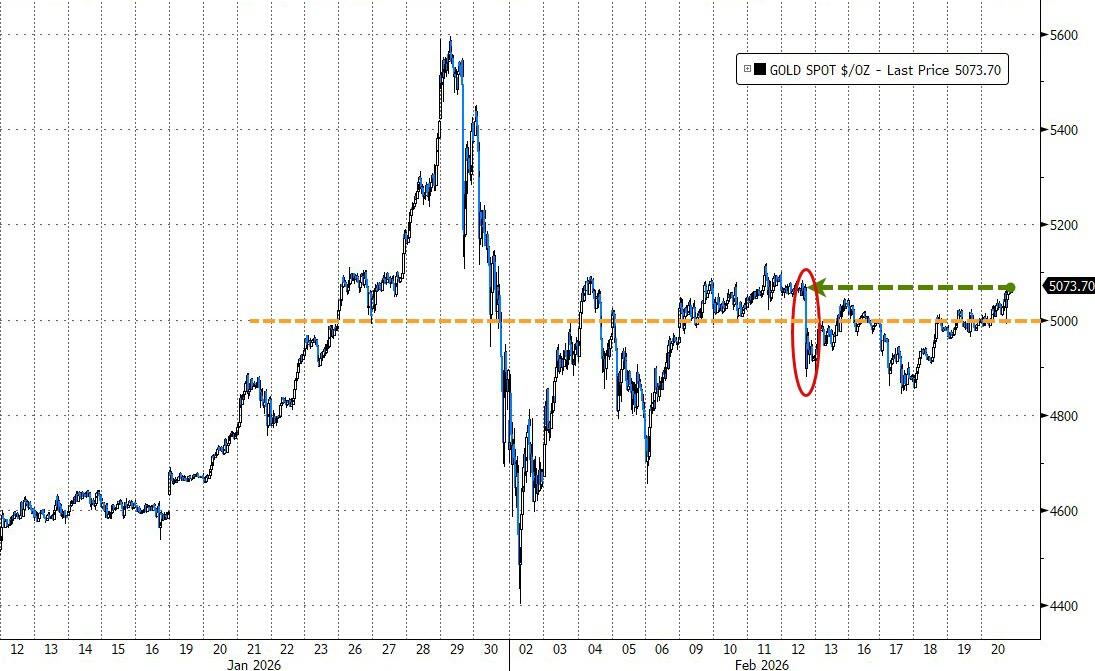
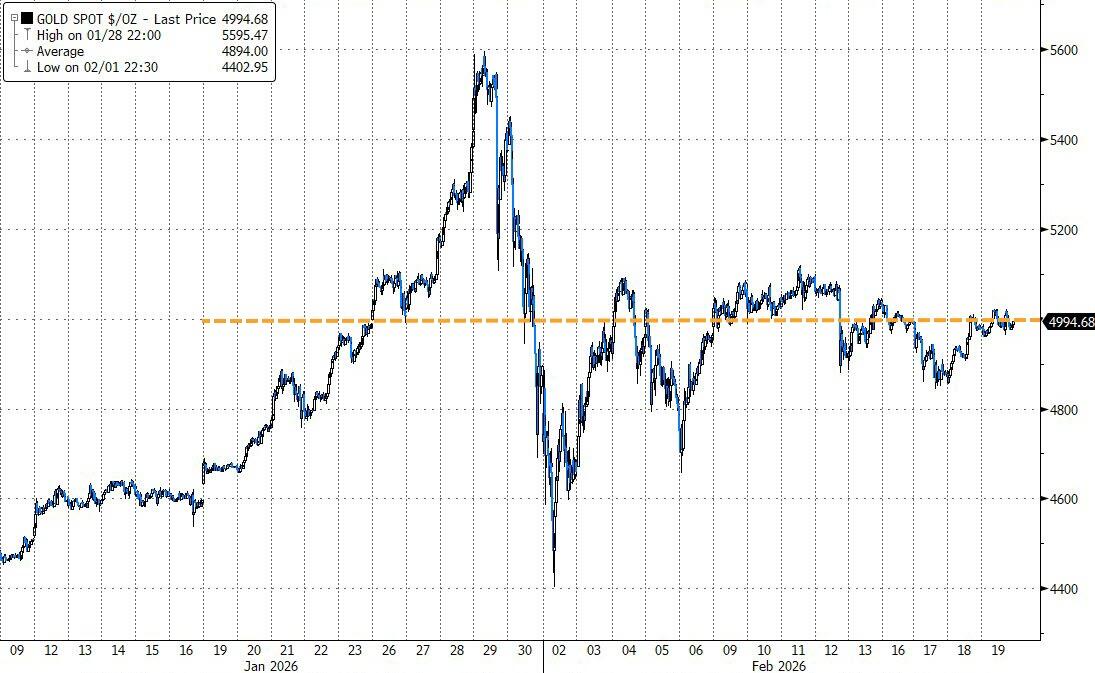
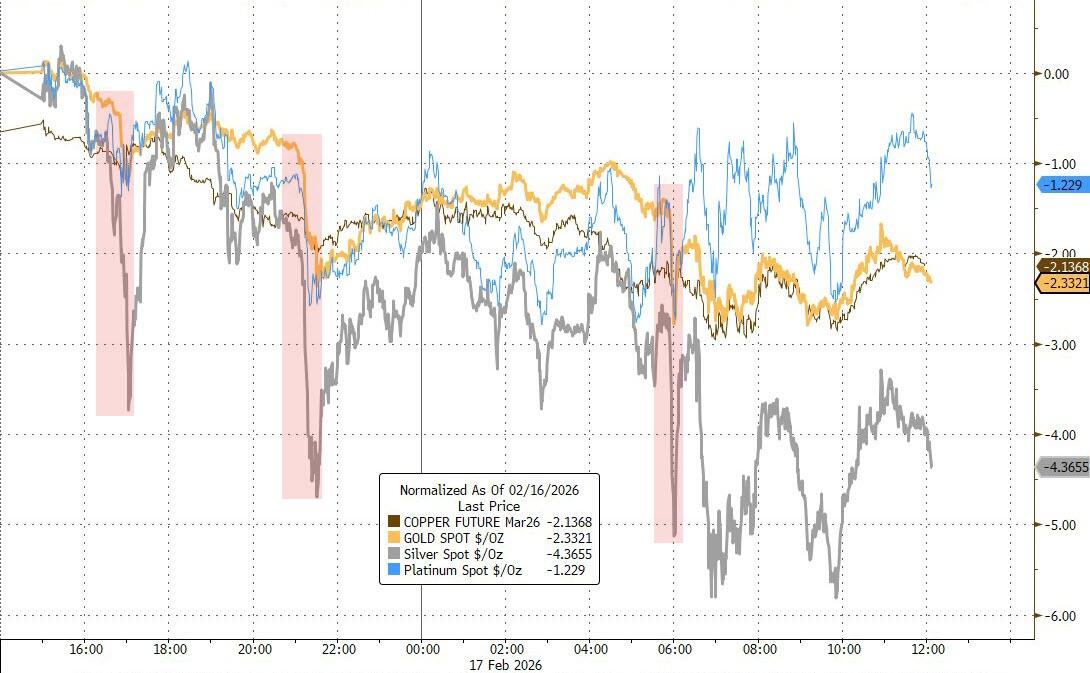
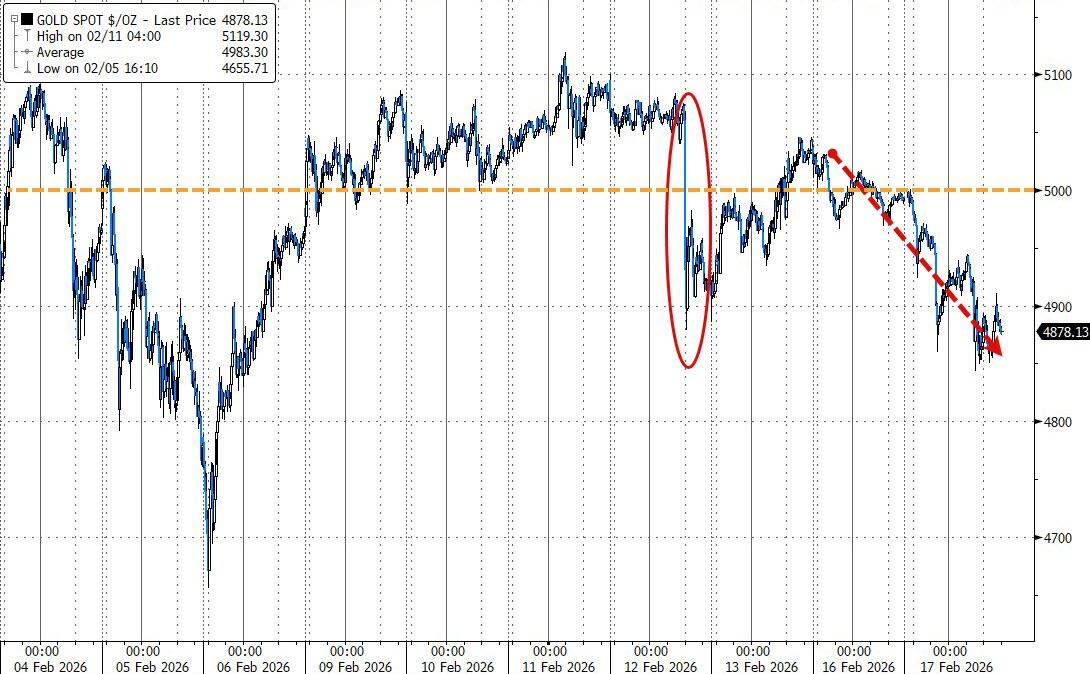
SILVER +7%, GOLD BACK ABOVE $5,100 – METALS KEEP WINNING
- Moving the market
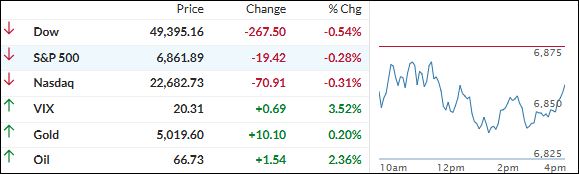
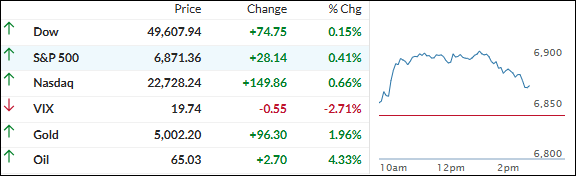
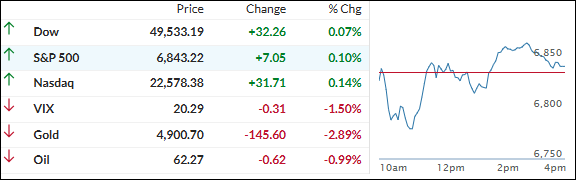
Stocks bounced back nicely after opening lower, as the Supreme Court struck down most of President Trump’s sweeping tariff policy under the International Emergency Economic Powers Act.
The majority ruled the law “does not authorize the President to impose tariffs,” which lifted retailers and companies that had been hammered by higher import and manufacturing costs last year.
The ruling didn’t address refunds for tariffs already paid, but Wall Street largely expected the decision anyway—economists think the White House will find other ways to reimpose many of the same duties, so the market reaction stayed pretty muted.
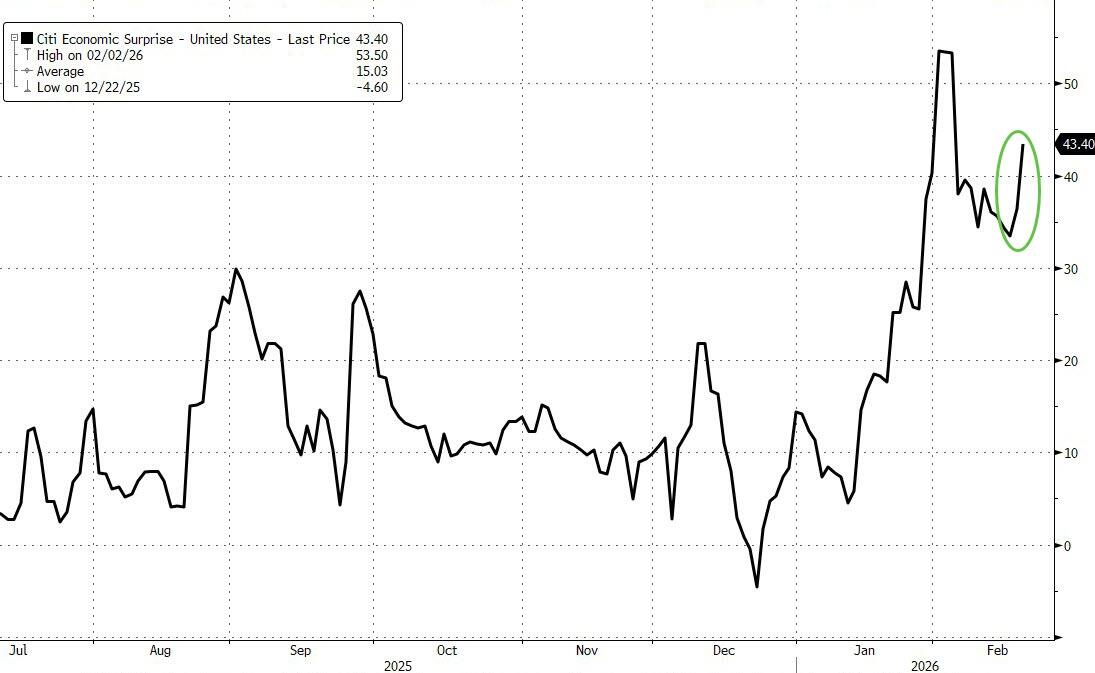
Earlier in the day, Q4 GDP came in softer than expected at 1.4% (vs. the forecasted 2.5%), a sharp slowdown from the 4.4% gain in Q3.
December core PCE inflation (the Fed’s favorite gauge) held steady at 3% YoY—above the 2% target but in line with estimates. That combo gave the Fed a bit more breathing room but didn’t spark any fireworks.
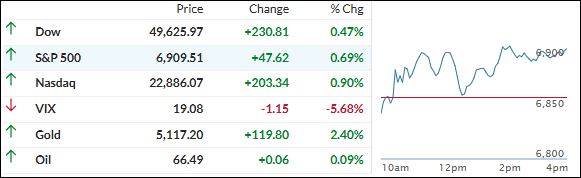
By week’s end, the S&P 500 and Nasdaq rallied to finish higher, though uncertainty around the Court’s decision and what comes next is still the big story.
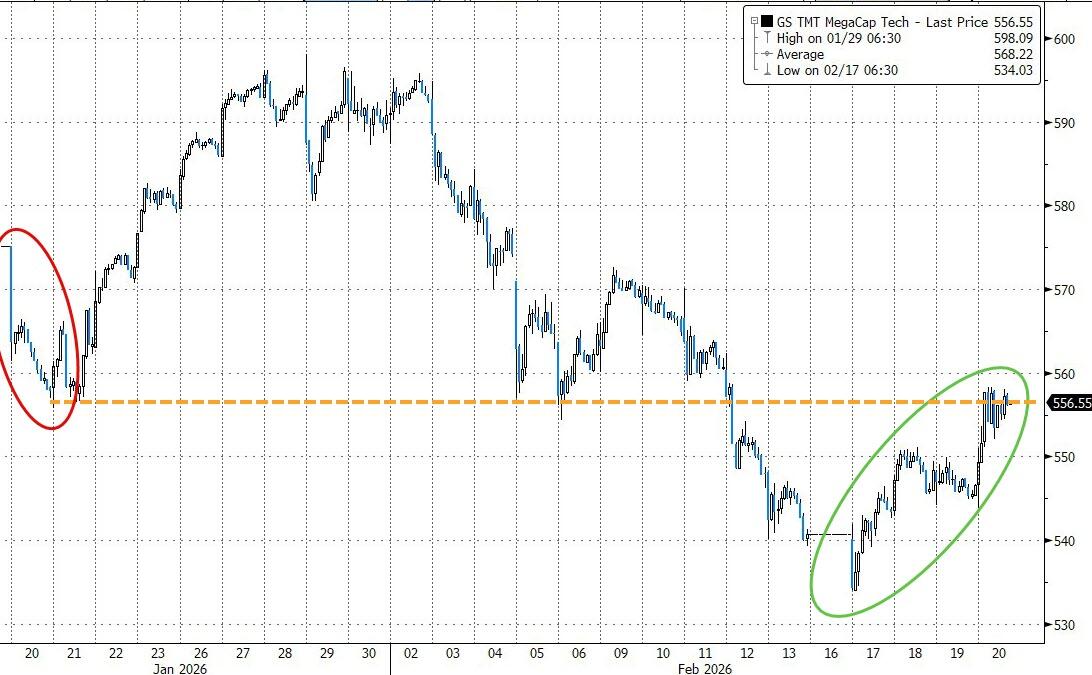
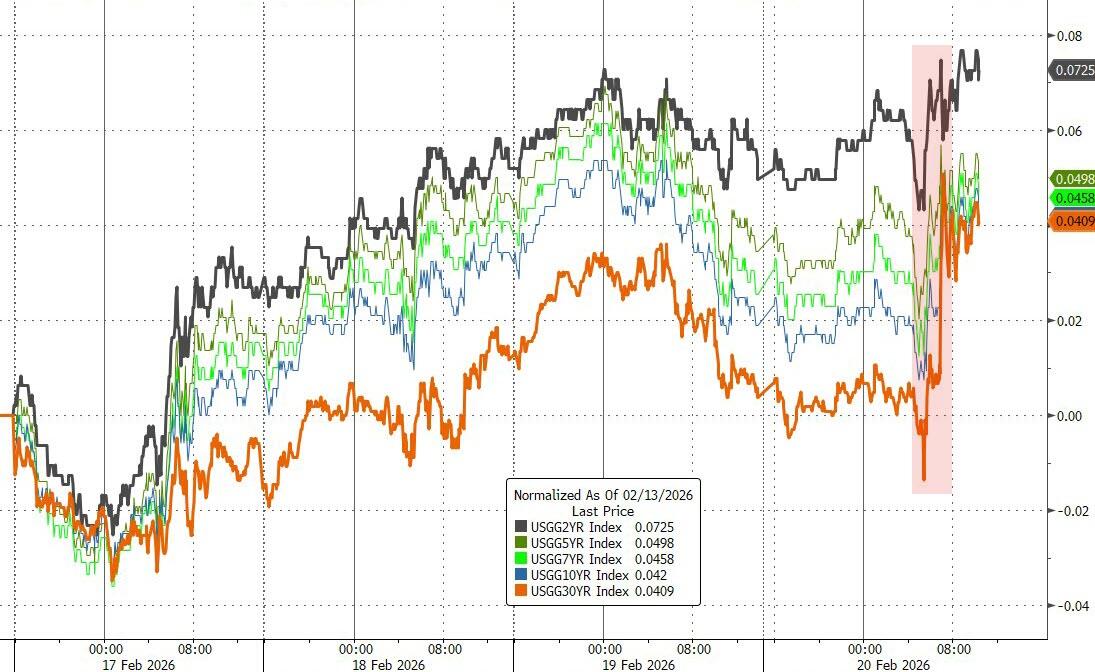
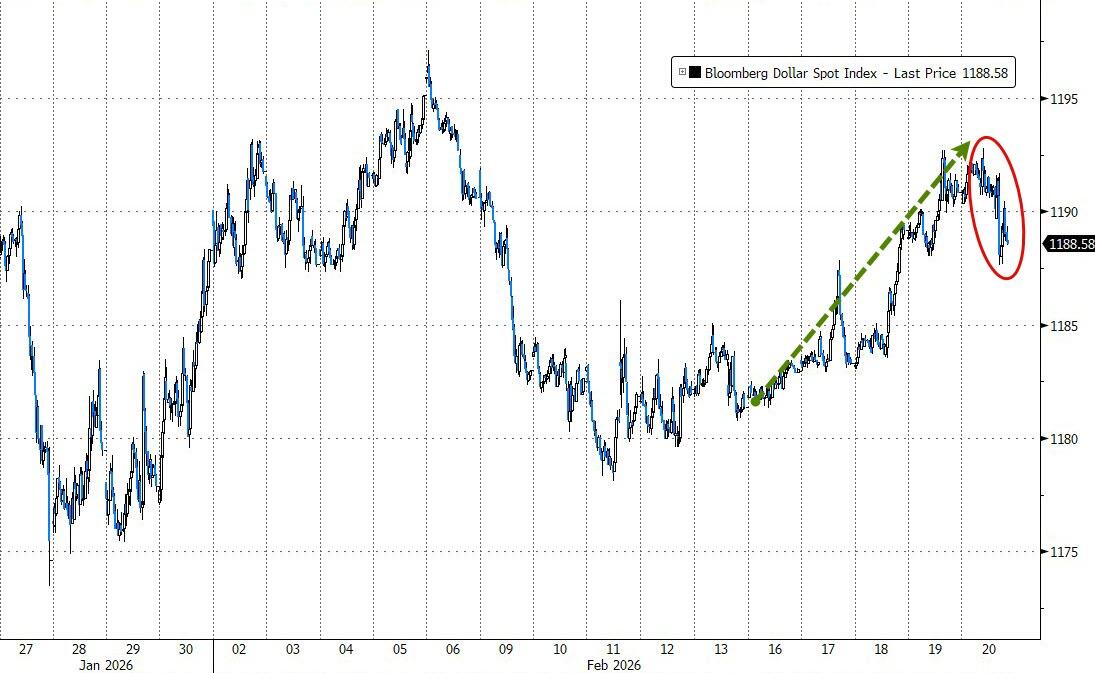
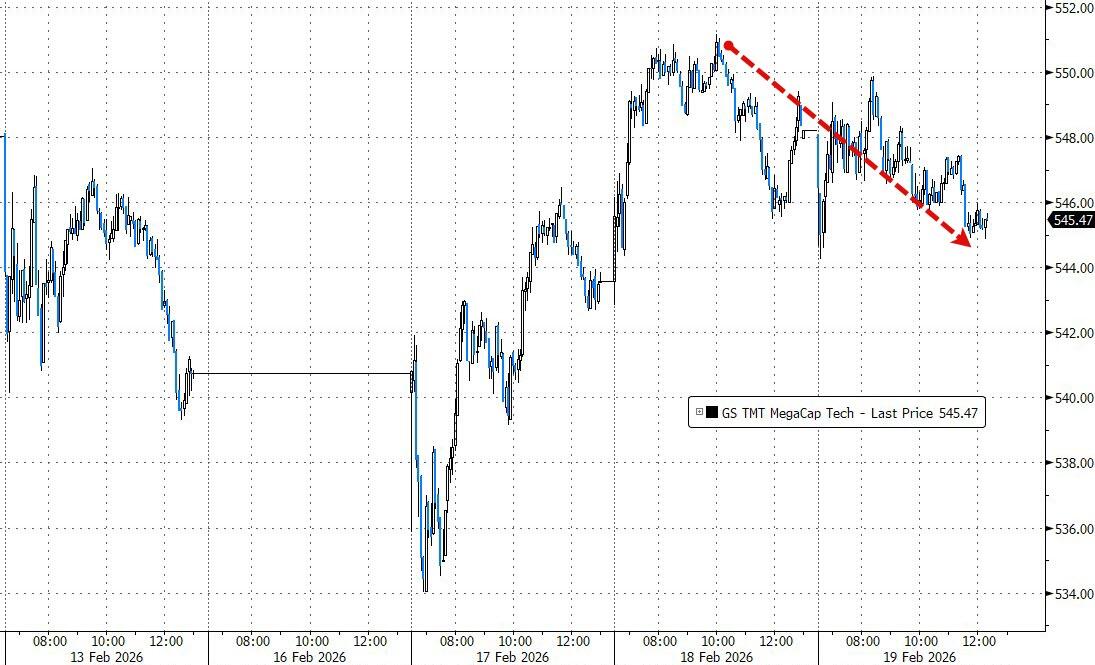
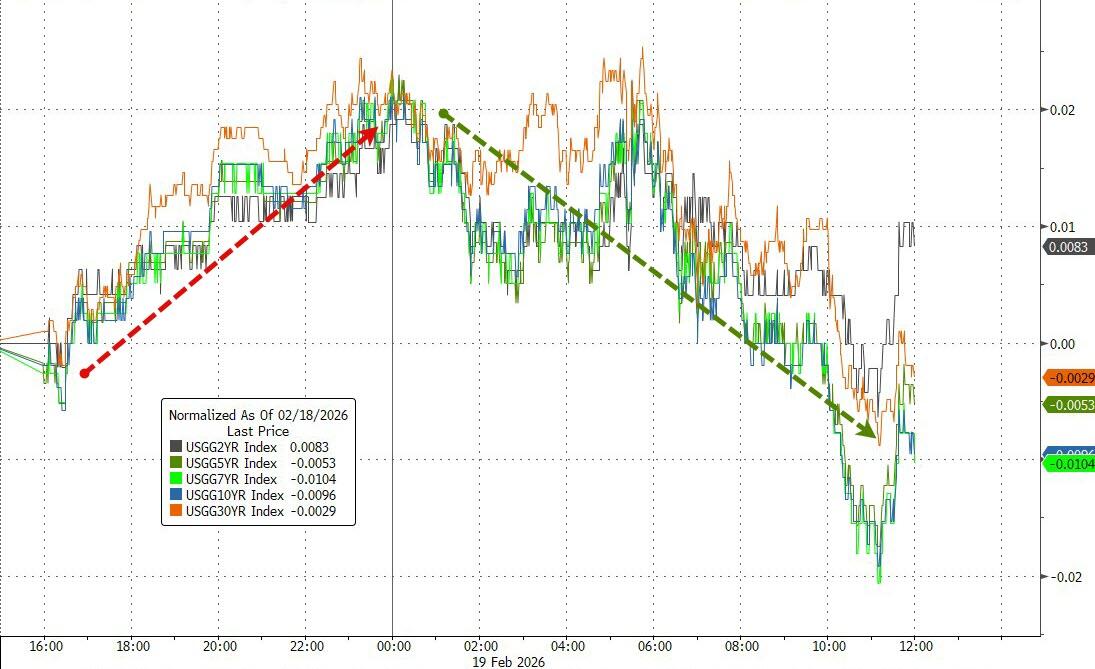
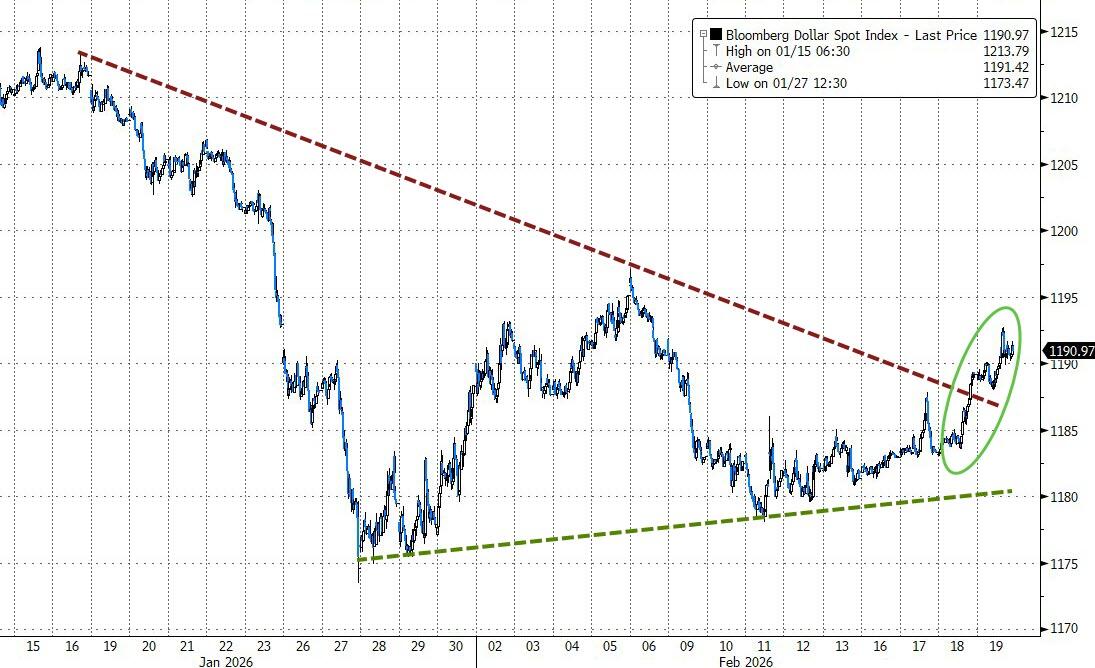
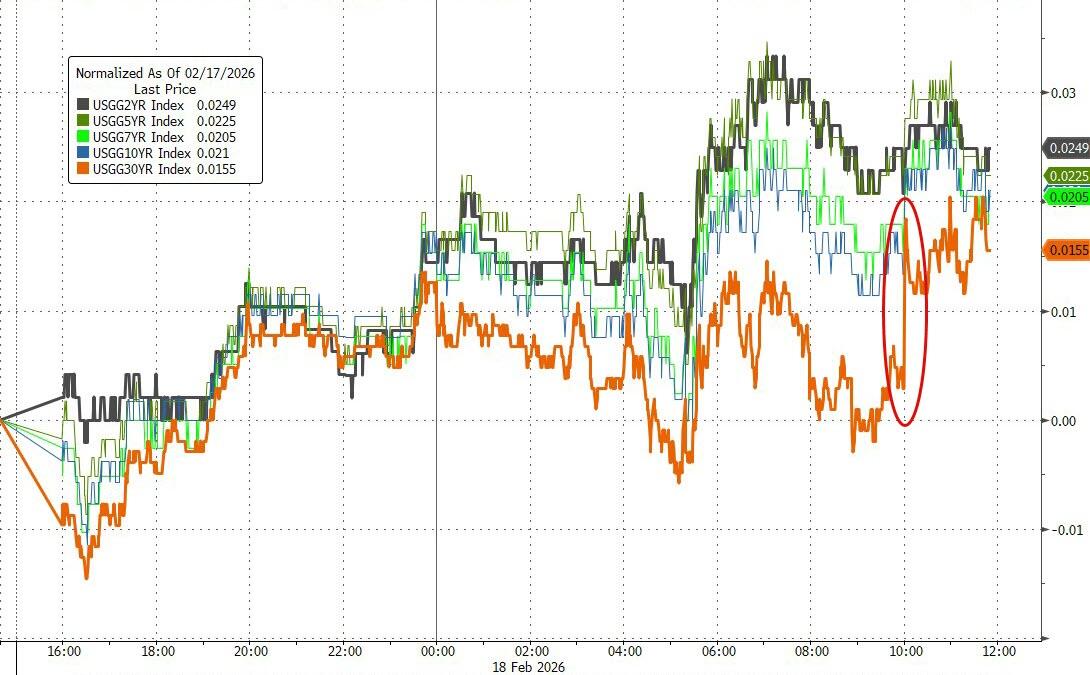
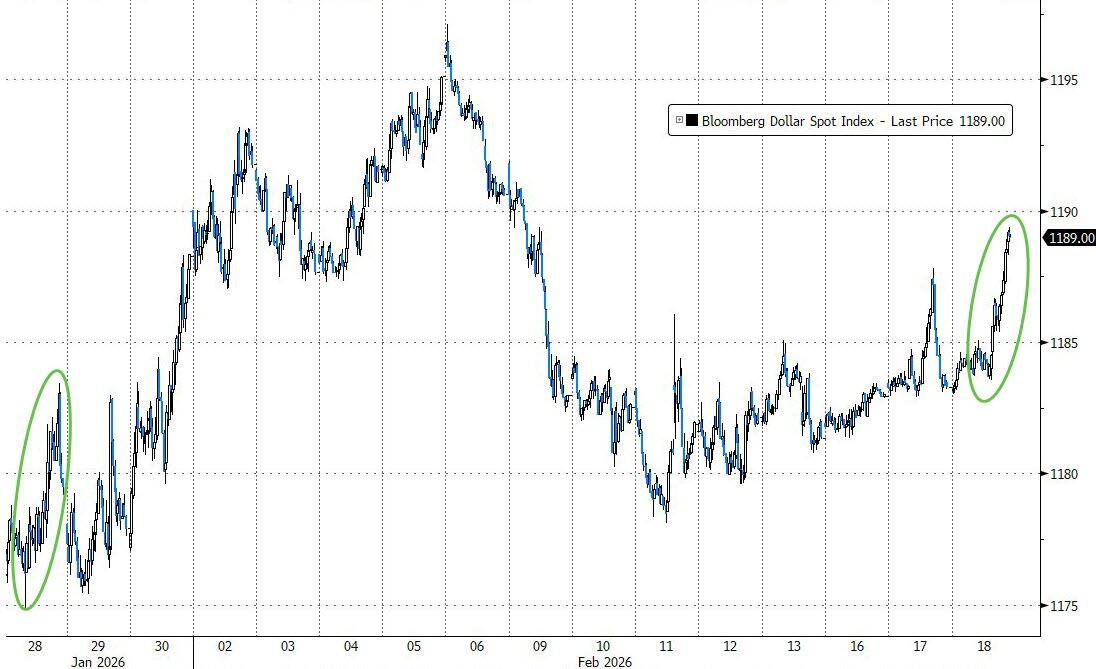
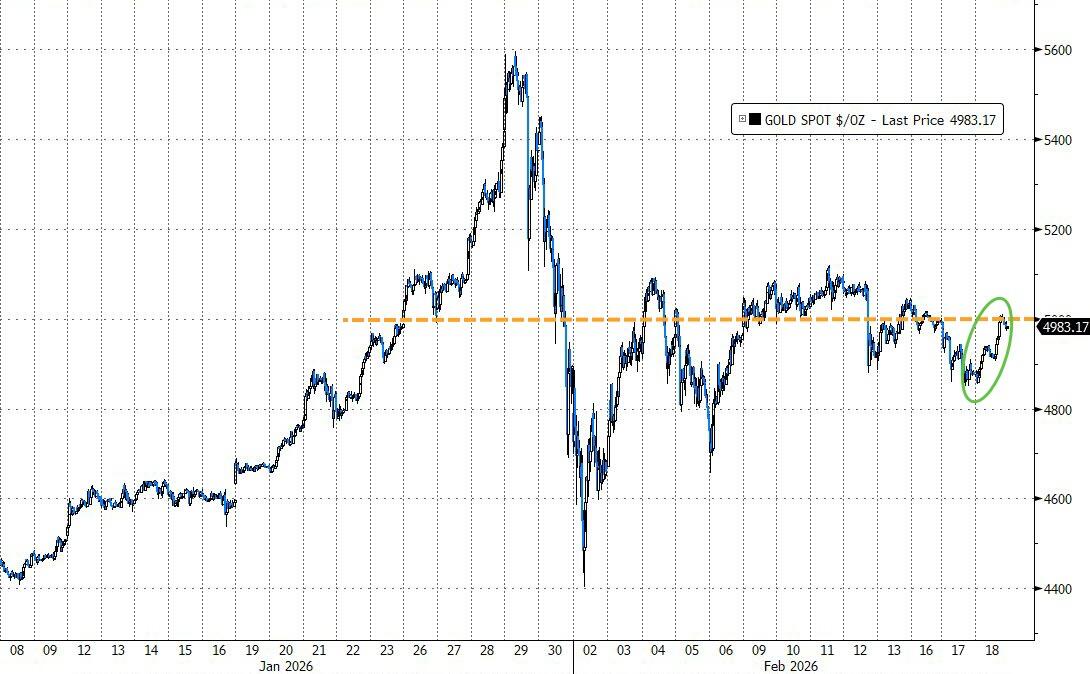
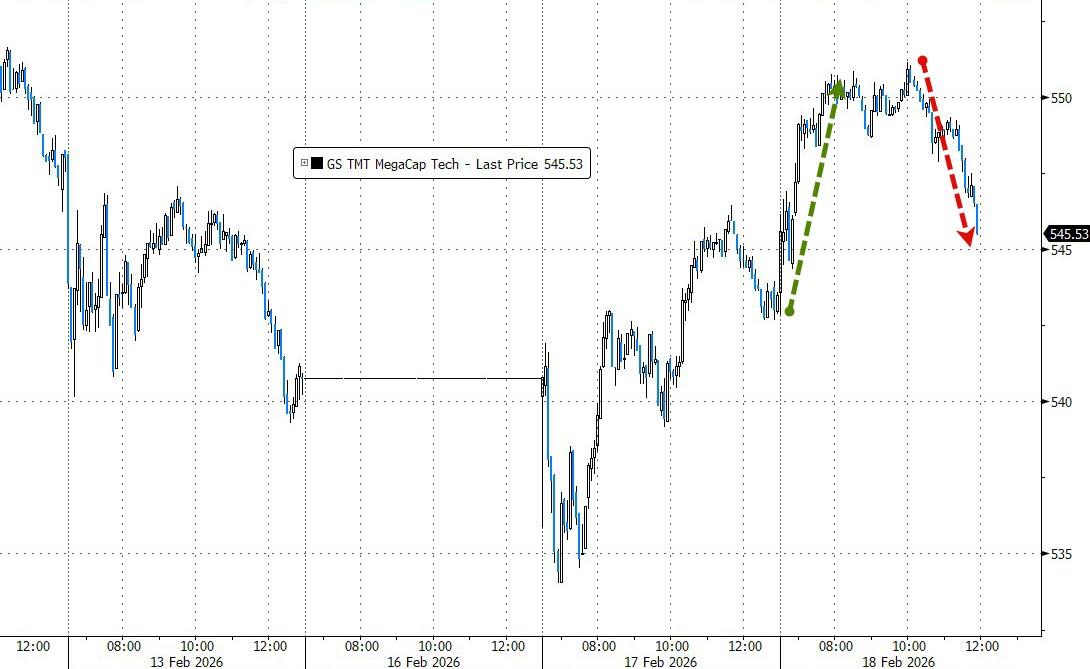
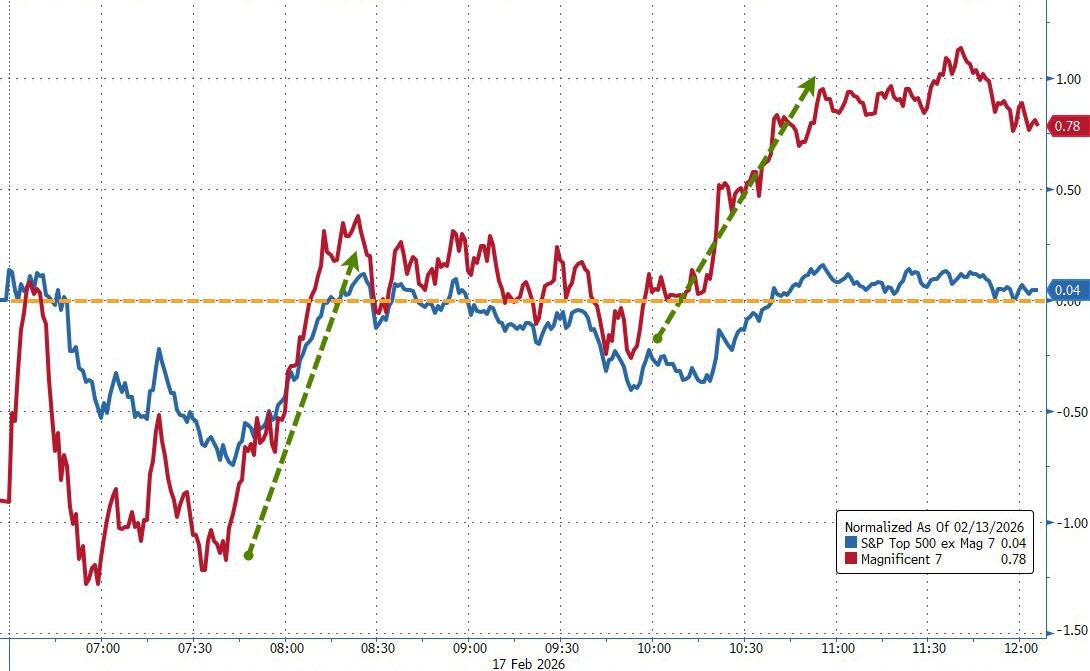
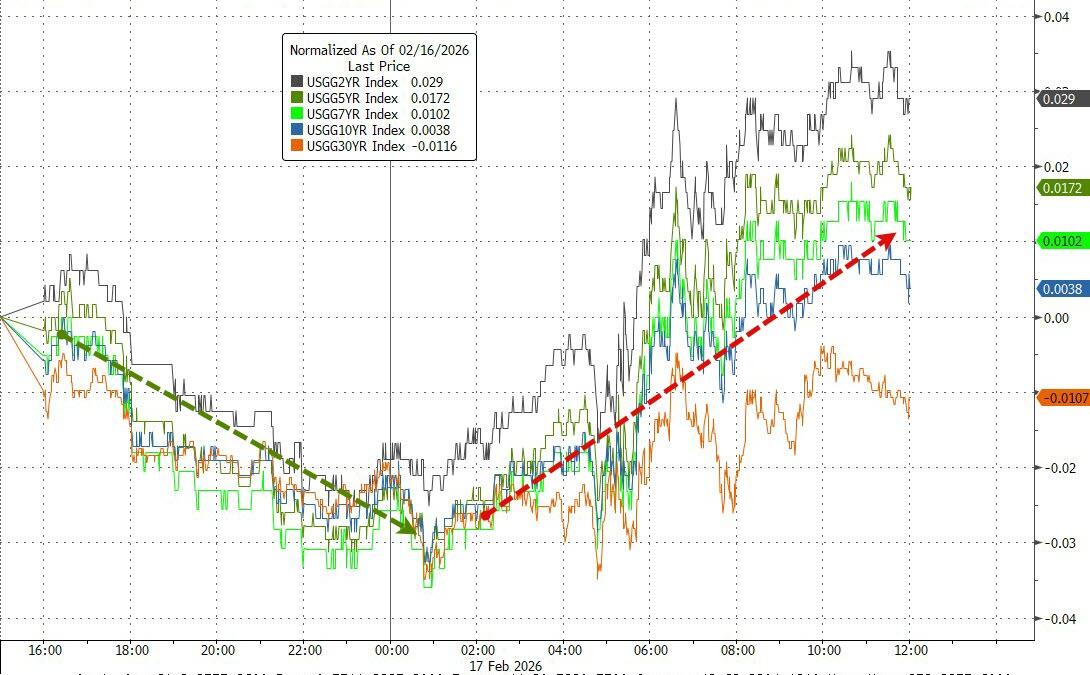
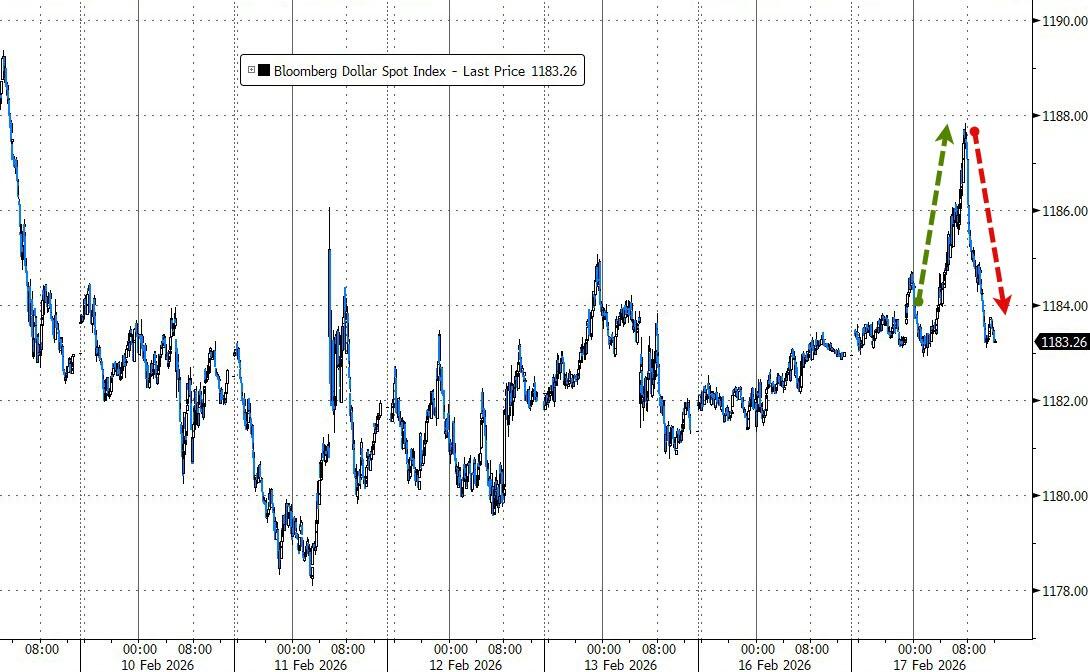
Mega-cap tech bounced back despite ongoing software weakness. Bond yields rose for the week (helping the dollar), but precious metals surged anyway—silver led with a +7% weekly gain, while gold pushed back above $5,100 for a modest weekly advance.
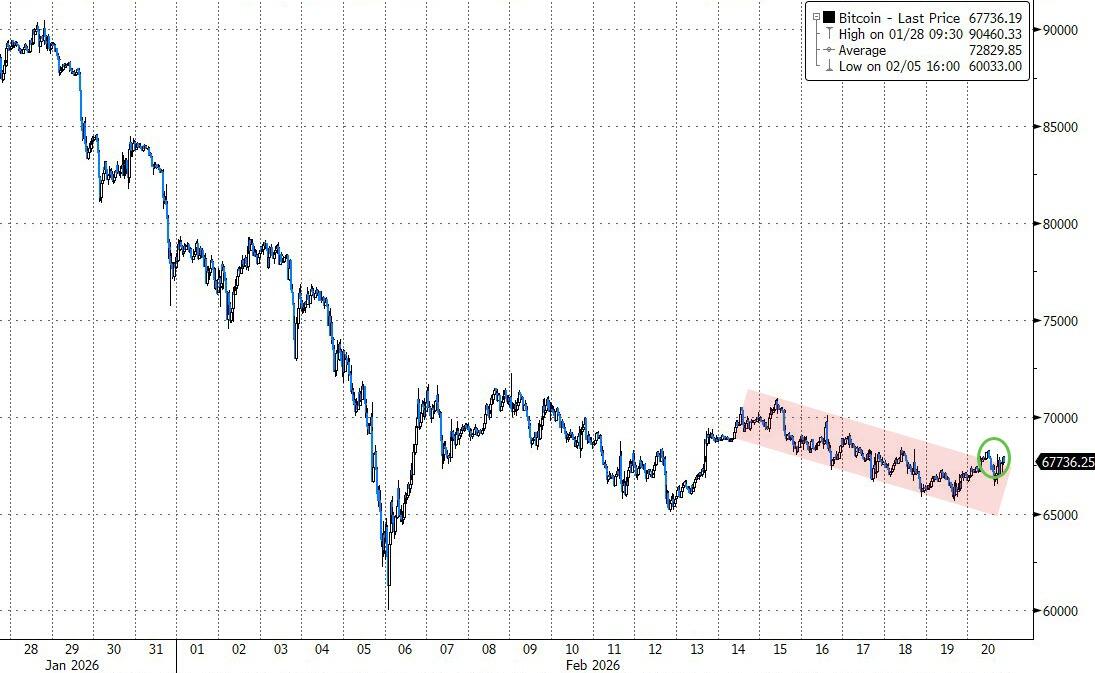
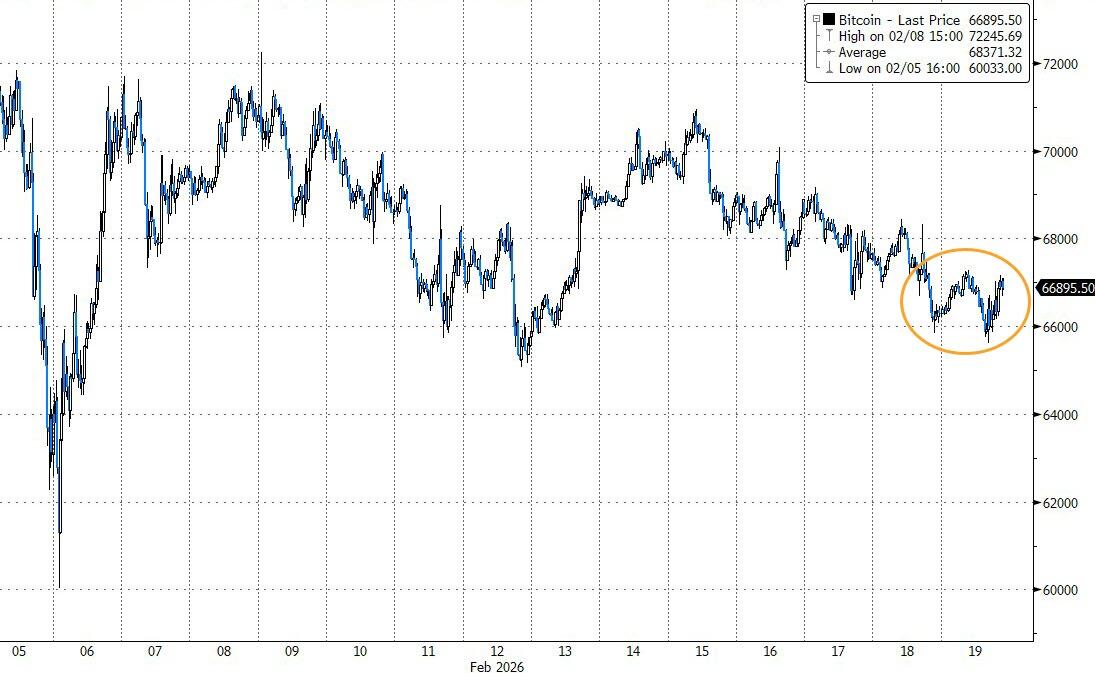
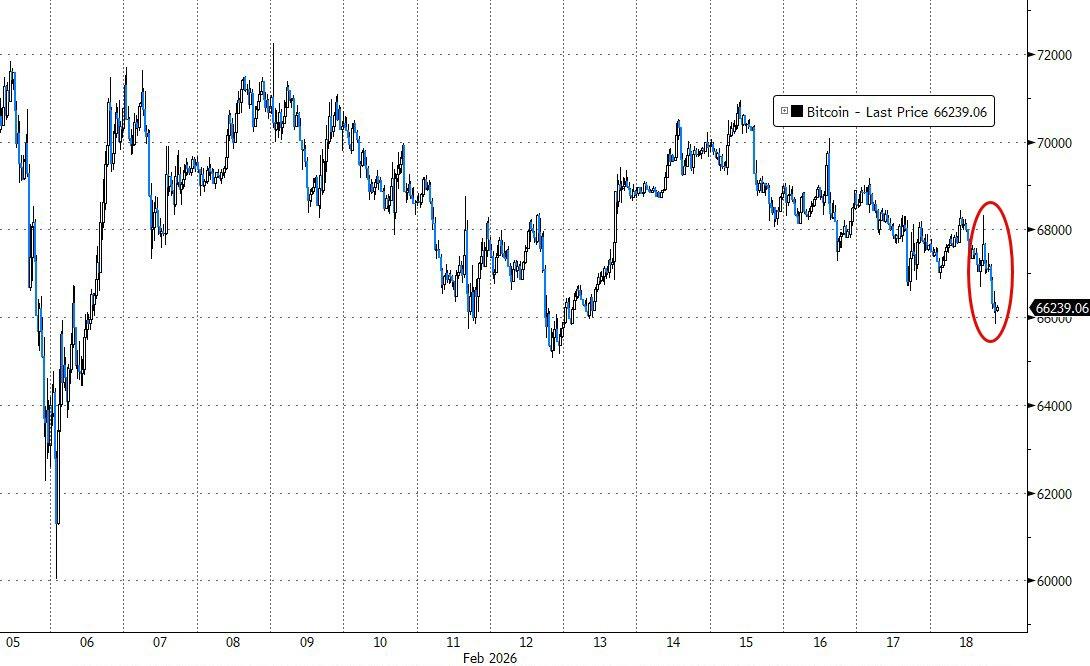
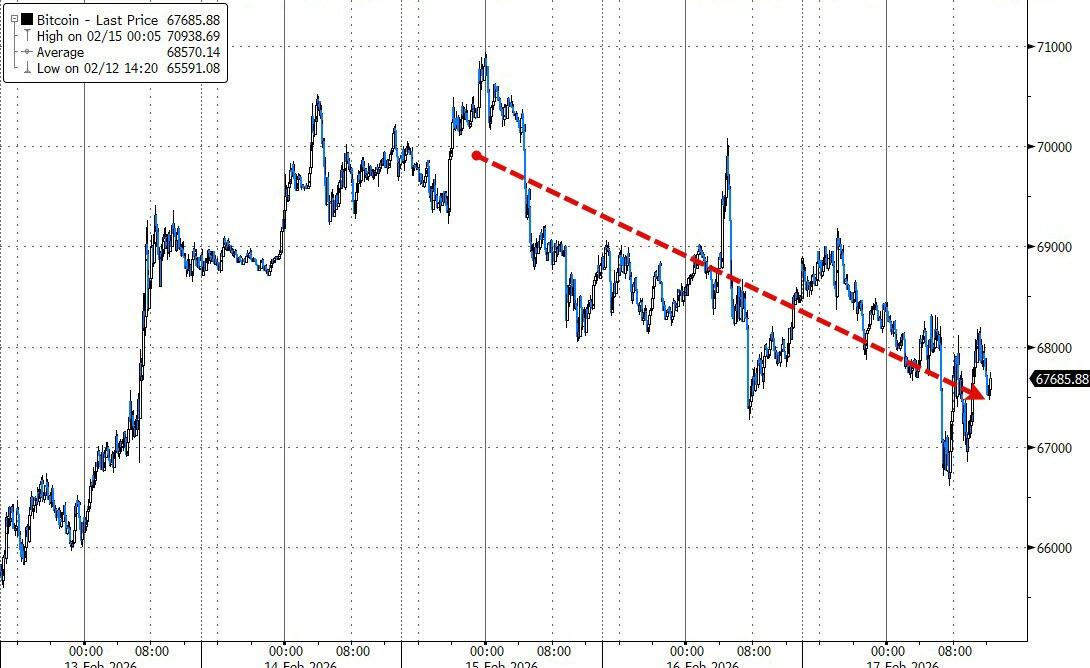
Bitcoin had a rough week but ended to the upside, potentially breaking out of its recent downtrend channel.
Right now, it feels like the market’s shrugging off the uncertainty and is ready for the next leg up… on the other hand, we could witness more chop until we see how the White House responds and NVDA’s earnings hit next week.
Read More