
- Moving the markets
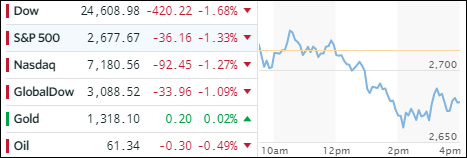
For the third day in a row, the major indexes got spanked again notching their worst decline in some three weeks as a trifecta of events combined to give the bears the upper hand.
First, there was Fed chair Powell, who has left the markets guessing how he feels about inflationary pressures by pronouncing on his second day on Capitol Hill that “we don’t want to fall behind the curve on inflation,” which was interpreted as hawkish.
Second, Fed governor Dudley joined the hawkish talk by educating the uninformed that 4 rate hikes in 2018 should be still considered ‘gradual.’
Third, President Trump added insult to an already weakening market and delivered the knock-out punch by announcing that he would impose tariffs on steel (25%) and aluminum (10%) imports adding to concerns about upcoming trade wars hurting corporations and consumers. That’s all it took to spook any remaining bulls as stocks, bond yields and the US Dollar headed south.
The 10-year bond yield gave back 6 basis points to close at 2.81%, while the US Dollar (UUP) lost -0.34%, and the major indexes each gave back in excess of 1%. Our Trend Tracking Indexes (TTIs), section 3 below, remain bullish and none of our trailing sell stops were triggered during today’s drubbing.
- ETFs in the Spotlight
In case you missed the announcement and description of this section, you can read it here again.
It features 10 broadly diversified and sector ETFs from my HighVolume list as posted every Saturday. Furthermore, they are screened for the lowest MaxDD% number meaning they have been showing better resistance to temporary sell offs than all others over the past year.
The below table simply demonstrates the magnitude with which some of the ETFs are fluctuating in regards to their positions above or below their respective individual trend lines (%M/A). A break below, represented by a negative number, shows weakness, while a break above, represented by a positive percentage, shows strength.
For hundreds of ETF choices, be sure to reference Thursday’s StatSheet.
Year to date, here’s how our candidates have fared so far:
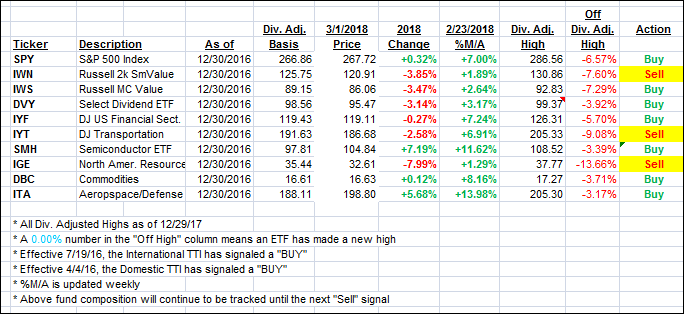
Again, the %M/A column above shows the position of the various ETFs in relation to their respective long term trend lines, while the trailing sell stops are being tracked in the “Off High” column. The “Action” column will signal a “Sell” once the -7.5% point has been taken out in the “Off High” column.
- Trend Tracking Indexes (TTIs)
Our Trend Tracking Indexes (TTIs) dove with the major indexes but remain on the bullish side of their respective trend lines.
Here’s how we closed 3/01/2018:
Domestic TTI: +2.33% above its M/A (last close +2.79%)—Buy signal effective 4/4/2016
International TTI: +1.86% above its M/A (last close +2.74%)—Buy signal effective 7/19/2016
Disclosure: I am obliged to inform you that I, as well as my advisory clients, own some of the ETFs listed in the above table. Furthermore, they do not represent a specific investment recommendation for you, they merely show which ETFs from the universe I track are falling within the guidelines specified.
Contact Ulli