Tax Cut Expectations Propel The Major Indexes

Ulli Market Commentary Contact

[Chart courtesy of MarketWatch.com]
  1. Moving the markets

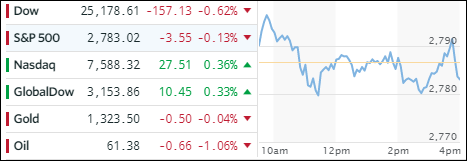
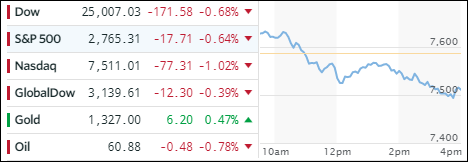
How many times have I referred to the expected tax law changes to be responsible for powering the equity markets? Too many to recall, but it appears to be the gift that keeps on giving. Today was no different, as the major indexes ended solidly in the green.

ZH summed the record run up as follows:

The Dow closed at its 70th record of the year… it has never done that before in its 100-year-plus history. Additionally, the S&P 500 is most overbought (weekly RSI) since 1958. There have been no down months since Trump was elected, and 2017 is shaping up to be a ‘Perfect Year.’ This would be the first time ever that stocks had 12 monthly gains in a row in a calendar year…

In ETF space we saw nothing but green numbers and solid gains across the board. Leading the pack was our YTD favorite, namely Semiconductors (SMH), with +1.76%. That was followed by SmallCaps (SCHA +1.35%), Transportations (IYT +1.29%) and MidCaps (SCHM +0.94%). Low man on the totem pole was Aerospace & Defense with +0.30%.

Interest rates headed higher with the yield on the 10-year bond adding 4 basis points to 2.39%. That did not help the 20-year bond price (TLT), which slipped -0.91%. Crude Oil was just about unchanged, but Gold managed to follow through on its recent rebound. The US Dollar (UUP) took a steep dive early on but managed to cut its losses to a modest -0.25%.

Read More

One Man’s Opinion: Is it Tuesday? Time for another Banking scandal

Ulli Market Review Contact

By Simon Black

Another day, another major banking scandal. It’s getting to the point where you can practically set your watch to these things.

The latest involves our old friend Wells Fargo. The Wall Street Journal reported last night that Wells has been screwing its customers on foreign currency exchange rates.

According to the Journal, Wells Fargo conducted an internal review of its fee arrangements and found that they had massively overcharged 88% of the sampled customers.

For example, the bank might have signed a contract with a customer to charge 0.15% on foreign currency transactions, but instead charged as much as 4%… about 26x higher than agreed.

It’s absurd to begin with that a bank would charge even a small percentage-based commission on foreign currency transactions (much less 4%), especially given that most of the transactions were to exchange euros and US dollars.

Sure, commissions are common in many industries.
Read More

ETFs On The Cutline – Updated Through 12/15/2017

Ulli ETFs on the Cutline Contact

Below please find the latest High Volume ETFs Cutline report, which shows how far above or below their respective long-term trend lines (39 week SMA) my currently tracked ETFs are positioned.

This report covers the HV ETF Master List from Thursday’s StatSheet and includes 366 High Volume ETFs ETFs, defined as those with an average daily volume of more than $5 million, of which currently 257 (last week 250) are hovering in bullish territory. The yellow line separates those ETFs that are positioned above their trend line (%M/A) from those that have dropped below it.

Take a look:

The HV ETF Master Cutline Report                               

In case you are not familiar with some of the terminology used in the reports, please read the Glossary of Terms.

If you missed the original post about the Cutline approach, you can read it here.

ETF Tracker Newsletter For December 15, 2017

Ulli ETF Tracker Contact

ETF Tracker StatSheet

https://theetfbully.com/2017/12/weekly-statsheet-etf-tracker-newsletter-updated-12142017/

 EXTENDING THE WEEKLY GAIN STREAK


[Chart courtesy of MarketWatch.com]
  1. Moving the markets

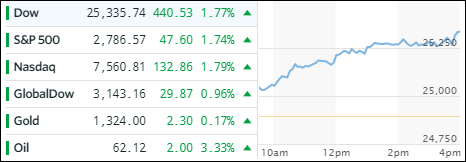
When looking at yesterday’s weakening market action, today can only be described as “opposite” day, as senators Rubio and Corker fell in line and announced a “Yes” vote to the long overdue agreement on Trump’s tax plan, as a last minute expansion of the child tax credit proved to be the solution. While this vote may not be chiseled in stone, it created enough optimism to torpedo the major indexes into record territory—again.

Equities scored some nice gains, and in ETF land we saw mostly green numbers. The only exception was International Equities (SCHF), which slipped -0.09%. On the plus side, we spotted several ETFs with gains above 1%. The number one spot was taken by our standby favorite, namely Semiconductors (SMH) with +1.64%. In close pursuit were Aerospace & Defense (ITA +1.62%), US SmallCaps (SCHA +1.24%) and MidCaps (SCHM +0.84%).

While the 10-year bond remained unchanged, the action was in the longer dated securities with the 20-year rallying +0.38% and honing in on its 2017 high as the yield curve continues to flatten (meaning that long term yields are falling while near term yields are rising). The US dollar (UUP) bounced back from its recent sell off and gained +0.41%.

Read More

Weekly StatSheet For The ETF Tracker Newsletter – Updated Through 12/14/2017

Ulli ETF StatSheet Contact

ETF Data updated through Thursday, December 14, 2017

Methodology/Use of this StatSheet:

  1. From the universe of over 1,800 ETFs, I have selected only those with a trading volume of over $5 million per day (HV ETFs), so that liquidity and a small bid/ask spread are assured.
  2. Trend Tracking Indexes (TTIs)

Buy or Sell decisions for Domestic and International ETFs (section 1 and 2), are made based on the respective TTI and its position either above or below its long-term M/A (Moving Average). A crossing of the trend line from below accompanied by some staying power above constitutes a “Buy” signal. Conversely, a clear break below the line constitutes a “Sell” signal. Additionally, I use a 7.5% trailing stop loss on all positions in these categories to control downside risk.

  1. All other investment arenas do not have a TTI and should be traded based on the position of the individual ETF relative to its own respective trend line (%M/A). That’s why those signals are referred to as a “Selective Buy.” In other words, if an ETF crosses its own trendline to the upside, a “Buy” signal is generated. Since these areas tend to be more volatile, I recommend a wider trailing sell stop of 7.5% -10% depending on your risk tolerance.

If you are unfamiliar with some of the terminology, please see Glossary of Terms and new subscriber information in section 9.


  1. DOMESTIC EQUITY ETFs: BUY — since 4/4/2016

Click on chart to enlarge

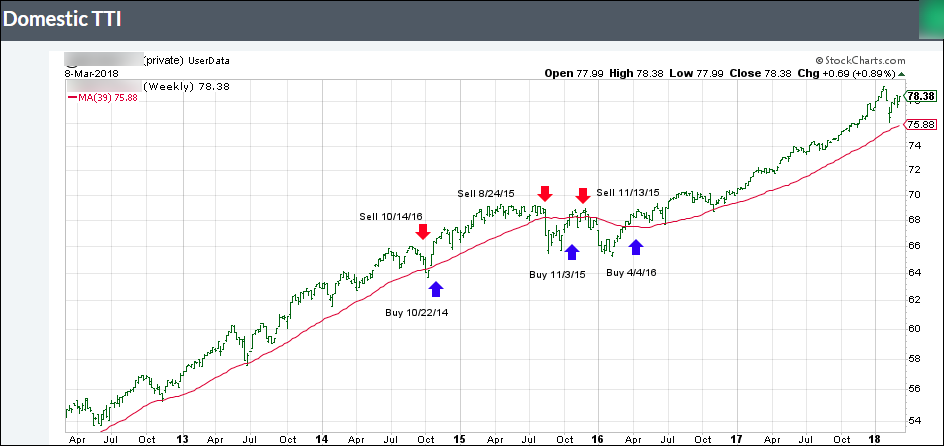
Our main directional indicator, the Domestic Trend Tracking Index (TTI-green line in the above chart) is positioned above its long-term trend line (red) by +3.39% after having generated a new Domestic Buy signal effective 4/4/2016 as posted.

Read More

When A Done Deal Is Apparently Not A Done Deal

Ulli Market Commentary Contact

[Chart courtesy of MarketWatch.com]
  1. Moving the markets

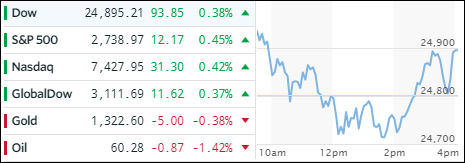
Market exuberance reigned early on and had the major indexes on track to set more record highs when jawboning by senators Rubio and Lee caused a case of severe tax-reform-anxiety. While we all thought the tax reform was a done deal, it does not appear so as questions regarding the “child tax credit” caused Lee to announce that he’s undecided and Rubio declaring a “No” vote unless changes are made.

That’s all it took, and the markets went into reversal mode and headed for the basement with prices ending at the day’s lows. In the bigger scheme of things the losses were small but losses nonetheless. In ETF space, we only saw red numbers. Giving back the most were US SmallCaps (SCHA) with -1.01% followed by Transportations (IYT) and Financials (XLF) with -0.71% and -0.65% respectively. Holding up the best were Semiconductors (SMH) with -0.04%.

Interest rates were mixed but the 20-year bond (TLT) outperformed by gaining +0.48%, while the High Yield sector (HYG) went the other way, traded in a wide range but only -0.21%. Gold continued its recovery and Crude Oil was solid with a +0.95% gain. The US Dollar (UUP) round tripped and faded into the close but managed to rebound +0.08%.

Read More