
- Moving the markets
How many times have I referred to the expected tax law changes to be responsible for powering the equity markets? Too many to recall, but it appears to be the gift that keeps on giving. Today was no different, as the major indexes ended solidly in the green.
ZH summed the record run up as follows:
The Dow closed at its 70th record of the year… it has never done that before in its 100-year-plus history. Additionally, the S&P 500 is most overbought (weekly RSI) since 1958. There have been no down months since Trump was elected, and 2017 is shaping up to be a ‘Perfect Year.’ This would be the first time ever that stocks had 12 monthly gains in a row in a calendar year…
In ETF space we saw nothing but green numbers and solid gains across the board. Leading the pack was our YTD favorite, namely Semiconductors (SMH), with +1.76%. That was followed by SmallCaps (SCHA +1.35%), Transportations (IYT +1.29%) and MidCaps (SCHM +0.94%). Low man on the totem pole was Aerospace & Defense with +0.30%.
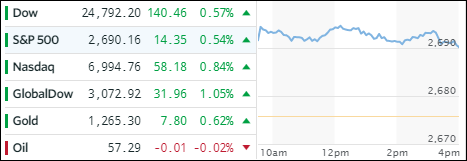
Interest rates headed higher with the yield on the 10-year bond adding 4 basis points to 2.39%. That did not help the 20-year bond price (TLT), which slipped -0.91%. Crude Oil was just about unchanged, but Gold managed to follow through on its recent rebound. The US Dollar (UUP) took a steep dive early on but managed to cut its losses to a modest -0.25%.
- ETFs in the Spotlight
In case you missed the announcement and description of this section, you can read it here again.
It features 10 broadly diversified and sector ETFs from my HighVolume list as posted every Saturday. Furthermore, they are screened for the lowest MaxDD% number meaning they have been showing better resistance to temporary sell offs than all others over the past year.
The below table simply demonstrates the magnitude with which some of the ETFs are fluctuating in regards to their positions above or below their respective individual trend lines (%M/A). A break below, represented by a negative number, shows weakness, while a break above, represented by a positive percentage, shows strength.
For hundreds of ETF choices, be sure to reference Thursday’s StatSheet.
Year to date, here’s how the 2017 candidates have fared so far:
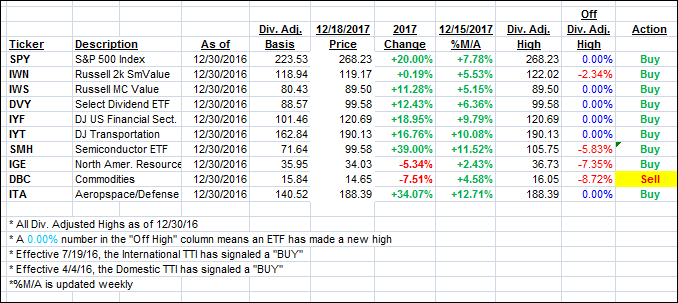
Again, the %M/A column above shows the position of the various ETFs in relation to their respective long term trend lines, while the trailing sell stops are being tracked in the “Off High” column. The “Action” column will signal a “Sell” once the -7.5% point has been taken out in the “Off High” column.
- Trend Tracking Indexes (TTIs)
Our Trend Tracking Indexes (TTIs) headed higher as the bulls ruled the day.
Here’s how we closed 12/18/2017:
Domestic TTI: +4.77% above its M/A (last close +4.54%)—Buy signal effective 4/4/2016
International TTI: +5.35% above its M/A (last close +4.59%)—Buy signal effective 7/19/2016
Disclosure: I am obliged to inform you that I, as well as my advisory clients, own some of the ETFs listed in the above table. Furthermore, they do not represent a specific investment recommendation for you, they merely show which ETFs from the universe I track are falling within the guidelines specified.
Contact Ulli