
ETF Tracker StatSheet
https://theetfbully.com/2017/12/weekly-statsheet-etf-tracker-newsletter-updated-12142017/
EXTENDING THE WEEKLY GAIN STREAK
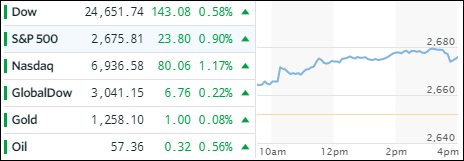
- Moving the markets
When looking at yesterday’s weakening market action, today can only be described as “opposite” day, as senators Rubio and Corker fell in line and announced a “Yes” vote to the long overdue agreement on Trump’s tax plan, as a last minute expansion of the child tax credit proved to be the solution. While this vote may not be chiseled in stone, it created enough optimism to torpedo the major indexes into record territory—again.
Equities scored some nice gains, and in ETF land we saw mostly green numbers. The only exception was International Equities (SCHF), which slipped -0.09%. On the plus side, we spotted several ETFs with gains above 1%. The number one spot was taken by our standby favorite, namely Semiconductors (SMH) with +1.64%. In close pursuit were Aerospace & Defense (ITA +1.62%), US SmallCaps (SCHA +1.24%) and MidCaps (SCHM +0.84%).
While the 10-year bond remained unchanged, the action was in the longer dated securities with the 20-year rallying +0.38% and honing in on its 2017 high as the yield curve continues to flatten (meaning that long term yields are falling while near term yields are rising). The US dollar (UUP) bounced back from its recent sell off and gained +0.41%.
- ETFs in the Spotlight
In case you missed the announcement and description of this section, you can read it here again.
It features 10 broadly diversified and sector ETFs from my HighVolume list as posted every Saturday. Furthermore, they are screened for the lowest MaxDD% number meaning they have been showing better resistance to temporary sell offs than all others over the past year.
The below table simply demonstrates the magnitude with which some of the ETFs are fluctuating in regards to their positions above or below their respective individual trend lines (%M/A). A break below, represented by a negative number, shows weakness, while a break above, represented by a positive percentage, shows strength.
For hundreds of ETF choices, be sure to reference Thursday’s StatSheet.
Year to date, here’s how the 2017 candidates have fared so far:
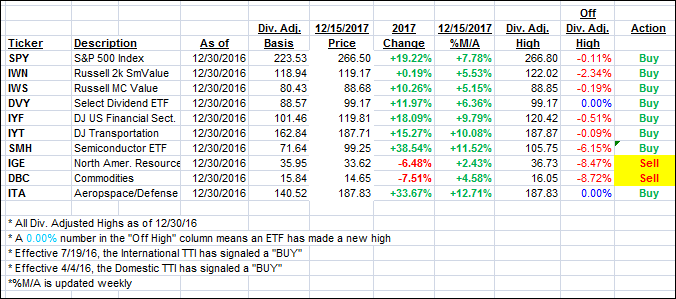
Again, the %M/A column above shows the position of the various ETFs in relation to their respective long term trend lines, while the trailing sell stops are being tracked in the “Off High” column. The “Action” column will signal a “Sell” once the -7.5% point has been taken out in the “Off High” column.
- Trend Tracking Indexes (TTIs)
Our Trend Tracking Indexes (TTIs) were mixed but clearly remain in bullish territory.
Here’s how we closed 12/15/2017:
Domestic TTI: +4.54% above its M/A (last close +3.39%)—Buy signal effective 4/4/2016
International TTI: +4.59% above its M/A (last close +4.90%)—Buy signal effective 7/19/2016
Disclosure: I am obliged to inform you that I, as well as my advisory clients, own some of the ETFs listed in the above table. Furthermore, they do not represent a specific investment recommendation for you, they merely show which ETFs from the universe I track are falling within the guidelines specified.
————————————————————-
READER Q & A FOR THE WEEK
All Reader Q & A’s are listed at our web site!
Check it out at:
https://theetfbully.com/questions-answers/
———————————————————-
WOULD YOU LIKE TO HAVE YOUR INVESTMENTS PROFESSIONALLY MANAGED?
Do you have the time to follow our investment plans yourself? If you are a busy professional who would like to have his portfolio managed using our methodology, please contact me directly or get more details at:
https://theetfbully.com/personal-investment-management/
———————————————————
Back issues of the ETF/No Load Fund Tracker are available on the web at:
https://theetfbully.com/newsletter-archives/
Contact Ulli