ETFs On The Cutline – Updated Through 12/22/2017

Ulli ETFs on the Cutline Contact

Below please find the latest High Volume ETFs Cutline report, which shows how far above or below their respective long-term trend lines (39 week SMA) my currently tracked ETFs are positioned.

This report covers the HV ETF Master List from Thursday’s StatSheet and includes 366 High Volume ETFs ETFs, defined as those with an average daily volume of more than $5 million, of which currently 239 (last week 257) are hovering in bullish territory. The yellow line separates those ETFs that are positioned above their trend line (%M/A) from those that have dropped below it.

Take a look:

The HV ETF Master Cutline Report                               

In case you are not familiar with some of the terminology used in the reports, please read the Glossary of Terms.

If you missed the original post about the Cutline approach, you can read it here.

ETF Tracker Newsletter For December 22, 2017

Ulli ETF Tracker Contact

ETF Tracker StatSheet

https://theetfbully.com/2017/12/weekly-statsheet-etf-tracker-newsletter-updated-12212017/

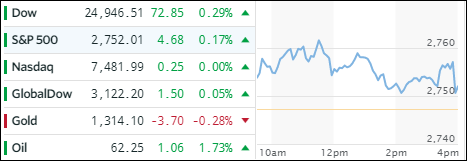
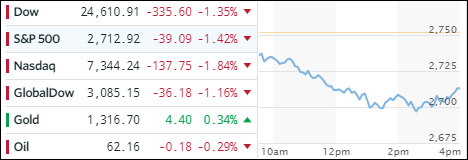
 CRAWLING BACK TOWARDS THE UNCHANGED LINE


[Chart courtesy of MarketWatch.com]
  1. Moving the markets

Despite today’s aimless meandering, which had the major indexes crawling out of a hole towards the unchanged line, the Dow and S&P 500 managed to score their fifth straight weekly advance despite ending the session slightly in the red. For sure, with the 3-day Holiday weekend ahead of us, there was not much motivation to push the indexes higher.

In light of the Dow’s and S&P’s strong 5-week performance, other asset classes did not fare so well. The Long bond had its worst week since the election, as interest rates rose, while the High Yield bond was down for the 4th week in a row.

Our widely held ETFs ended the day mixed. Heading higher were Emerging Markets (SCHE +0.76%), International SmallCaps (SCHC +0.50%) and Transportations (IYT +0.41%), with the laggards being Financials (XLF -0.28%) and US SmallCaps (SCHA -0.09%). Gold edged up, Crude Oil stayed about even, and the US Dollar (UUP) was range bound but gained a tiny +0.04%.

I will post the “ETFs on the Cutline” report tomorrow and will be back on Tuesday with the market commentary.

In the meantime, I wish you a Merry Christmas!

Ulli…

Read More

Weekly StatSheet For The ETF Tracker Newsletter – Updated Through 12/21/2017

Ulli ETF StatSheet Contact

ETF Data updated through Thursday, December 21, 2017

Methodology/Use of this StatSheet:

  1. From the universe of over 1,800 ETFs, I have selected only those with a trading volume of over $5 million per day (HV ETFs), so that liquidity and a small bid/ask spread are assured.
  2. Trend Tracking Indexes (TTIs)

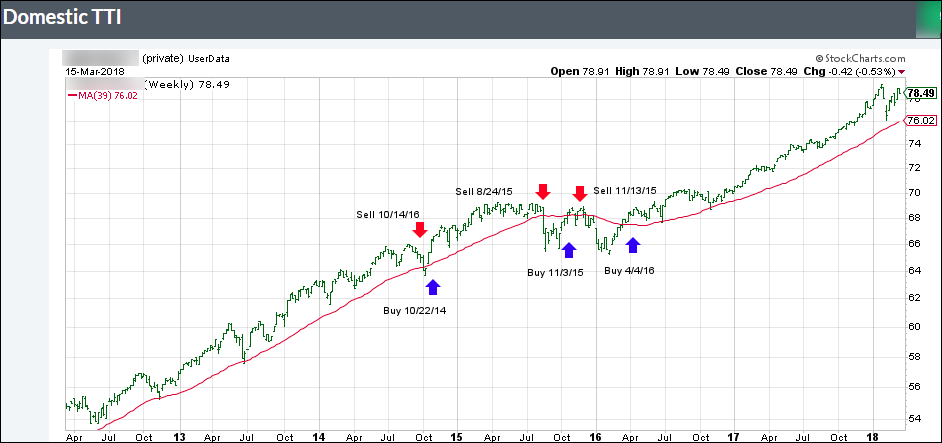
Buy or Sell decisions for Domestic and International ETFs (section 1 and 2), are made based on the respective TTI and its position either above or below its long-term M/A (Moving Average). A crossing of the trend line from below accompanied by some staying power above constitutes a “Buy” signal. Conversely, a clear break below the line constitutes a “Sell” signal. Additionally, I use a 7.5% trailing stop loss on all positions in these categories to control downside risk.

  1. All other investment arenas do not have a TTI and should be traded based on the position of the individual ETF relative to its own respective trend line (%M/A). That’s why those signals are referred to as a “Selective Buy.” In other words, if an ETF crosses its own trendline to the upside, a “Buy” signal is generated. Since these areas tend to be more volatile, I recommend a wider trailing sell stop of 7.5% -10% depending on your risk tolerance.

If you are unfamiliar with some of the terminology, please see Glossary of Terms and new subscriber information in section 9.


  1. DOMESTIC EQUITY ETFs: BUY — since 4/4/2016

Click on chart to enlarge

Our main directional indicator, the Domestic Trend Tracking Index (TTI-green line in the above chart) is positioned above its long-term trend line (red) by +4.07% after having generated a new Domestic Buy signal effective 4/4/2016 as posted.

Read More

Hunting For A Fresh Catalyst

Ulli Market Commentary Contact

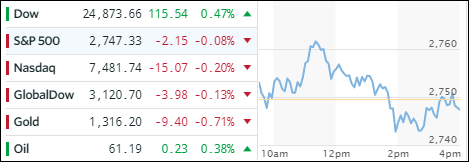
[Chart courtesy of MarketWatch.com]
  1. Moving the markets

With the tax reform package now being a done deal, the markets were in need of a new catalyst to continue their bullish theme. Since there was none to speak of, equities simply rallied higher because… well… that’s what they do. Energy, Financials and Telecom contributed to the positive outcome, but the mid-session highs of the major indexes were unsustainable, and we slipped into the close.

In the end, our most widely followed ETFs had some pluses and minuses with the overall outcome being positive. Taking the lead for the day were Emerging Markets (SCHE) with +0.88% closely followed by Financials (XLF) with +0.82%. On the downside, we saw Semiconductors (SMH) giving back -1.04% while the Dividend ETF (SCHD) surrendered a more modest -0.21%.

Interest rates dropped slightly allowing the 20-year bond (TLT) to finally show a green close (+0.37%) after 3 days of devastating losses. Gold and Crude Oil ended slightly higher as the US Dollar (UUP) went predominantly sideways and closed down a tiny -0.04%.

Read More

Tax-Revamp Boost Runs Out Of Steam

Ulli Market Commentary Contact

[Chart courtesy of MarketWatch.com]
  1. Moving the markets

The major indexes slipped a bit as the much touted and hyped tax deal appeared to be done, and the legislation was finally sent to President Trump for his signature. It seems that the bill’s passage left investors emotionally exhausted and apathetic as the actual news was a non-event in terms of market direction.

Despite an early bounce, the indexes spent the day hovering slightly above and below their respective unchanged lines, which was reflected in a mixed performance in the ETF space. Leading to the upside were Transportations (IYT +0.94%), Semiconductors (SMH +0.65%) and International SmallCaps (SCHC +0.28%). Giving back some of their recent gains were the Financials (XLF -0.18%) and International Equities (SCHF -0.06%).

Interest rates continued to surge with the 10-year bond yield adding another 3 basis points to 2.49%, its highest level since last March. That rise resulted in another spanking for the 30-year bond (TLT), which gapped down for the second day in a row (-1.11%) to a 4-week low. The US dollar (UUP) followed suit by losing -0.12% and remaining below its 50-day M/A.

Read More

Falling Off The Highs

Ulli Market Commentary Contact

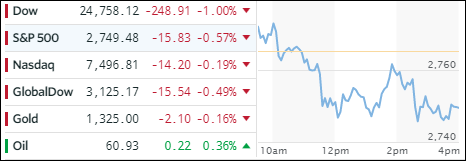
[Chart courtesy of MarketWatch.com]
  1. Moving the markets

The major indexes slipped today as all eyes remained firmly focused on the tax package, which originally was supposed to be signed by President Trump today. However, after the markets closed, the process “hit a procedural snag” forcing another vote on Wednesday. Whether that will finally cinch the deal is everyone’s guess.

Equities headed south, after a short-lived early bounce, and the ETF space was no exception, as we gave back some of the gains of the last couple of days. Showing the only green number was the Dividend ETF (SCHD) with +0.06%. Surrendering the most were SmallCaps (SCHA) with -0.66% followed by Financials (XLF -0.43%) and Aerospace & Defense (ITA -0.41%).

Yesterday’s interest rate spike continued with the 10-year yield bouncing sharply higher by adding 7 basis points to 2.46% matching the late October high. As a result, the 20-year bond (TLT) got hammered and lost -1.30%. In summary, it was one of those days were bonds and equities were down simultaneously. The US Dollar (UUP) traded in a wide range but lost only -0.29%.

Read More