ETF Tracker Newsletter For May 11, 2018

Ulli ETF Tracker Contact

ETF Tracker StatSheet

https://theetfbully.com/2018/05/weekly-statsheet-for-the-etf-tracker-newsletter-updated-through-05-10-2018/

 COMEBACK KID

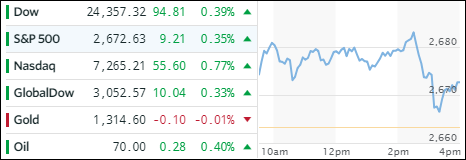
[Chart courtesy of MarketWatch.com]
  1. Moving the markets

After slumping last week, and threatening to break our long-term trend lines to the downside into bearish territory, this week was just the opposite with the major indexes staging a comeback with each of them gaining over 2%. While we saw some jumpiness today, the Dow and S&P managed to close in the green.

Despite some negative news headlines, none of them were strong enough to spoil the party. Even Trump’s proposed major healthcare changes pulled the indexes down only temporarily before a rebound into the close started.

Overall, the mood was upbeat as Wall Street reflected on solid earnings reports along with slipping bond yields with the 10-year being able to remain below the critical 3% level (2.97%), which seems to be the line in the sand for the bulls and the bears.

Another assist came from the US dollar, which has been on a slippery slope lately. Both of these factors can generate a lot of headwind for equities as rising rates and a strong dollar will make US products harder to sell for those companies doing business abroad.

Our Trend Tracking Indexes (TTIs) are out of the danger zone with both of them having safely moved away from a point that signals a potential break into bearish territory (section 3). That is, at least for the time being.

Read More

Weekly StatSheet For The ETF Tracker Newsletter – Updated Through 05/10/2018

Ulli ETF StatSheet Contact

ETF Data updated through Thursday, May 10, 2018

Methodology/Use of this StatSheet:

  1. From the universe of over 1,800 ETFs, I have selected only those with a trading volume of over $5 million per day (HV ETFs), so that liquidity and a small bid/ask spread are assured.
  2. Trend Tracking Indexes (TTIs)

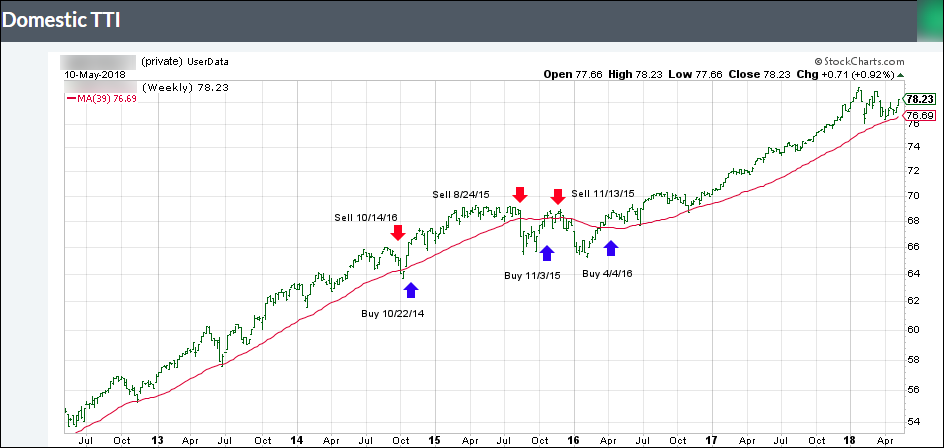
Buy or Sell decisions for Domestic and International ETFs (section 1 and 2), are made based on the respective TTI and its position either above or below its long-term M/A (Moving Average). A crossing of the trend line from below accompanied by some staying power above constitutes a “Buy” signal. Conversely, a clear break below the line constitutes a “Sell” signal. Additionally, I use a 7.5% trailing stop loss on all positions in these categories to control downside risk.

  1. All other investment arenas do not have a TTI and should be traded based on the position of the individual ETF relative to its own respective trend line (%M/A). That’s why those signals are referred to as a “Selective Buy.” In other words, if an ETF crosses its own trendline to the upside, a “Buy” signal is generated. Since these areas tend to be more volatile, I recommend a wider trailing sell stop of 7.5% -10% depending on your risk tolerance.

If you are unfamiliar with some of the terminology, please see Glossary of Terms and new subscriber information in section 9.


  1. DOMESTIC EQUITY ETFs: BUY — since 4/4/2016

Click on chart to enlarge

Our main directional indicator, the Domestic Trend Tracking Index (TTI-green line in the above chart) is positioned above its long-term trend line (red) by +2.16% after having generated a new Domestic Buy signal effective 4/4/2016 as posted.

Read More

Stocks Jump As Dollar Dumps

Ulli Market Commentary Contact

[Chart courtesy of MarketWatch.com]
  1. Moving the markets

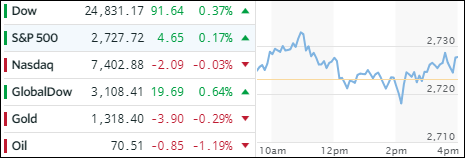
Muted inflation fears were one part of the puzzle that helped the markets score another win with the major indexes gaining across the board.

First, today’s reading on April consumer prices came in at +0.1%, which was a tad below estimates. Second, the 10-year bond yield pulled back and did not close above the much feared 3% level. Third, to make sure the markets were going to close in the green, the VIX was clubbed again and tumbled to 12 from yesterday’s 13 level.

This triple combination was enough to control any bearish thoughts and let the bulls have another chest pounding session. Even news headlines that 2 of the biggest hedge fund managers opined that “This is not a time to be rewarded for long market exposure…” while announcing their increased short holdings, did nothing to reduce the bullish fever—at least not yet.

Despite market anxieties appearing to have taken a step back, the jury is still out as to whether this will be a resumption of the prior bull market or, as some fund managers believe, simply a sign of a blow off top.

While gold and oil edged higher as well, the US Dollar (UUP) got spanked and lost -0.47%, its biggest drop in 2 months. However, due to its recent rebound, UUP is still positioned on the positive side of its 50- and 200-day M/As.

Read More

Energy And Financials Propel The Indexes

Ulli Market Commentary Contact

[Chart courtesy of MarketWatch.com]
  1. Moving the markets

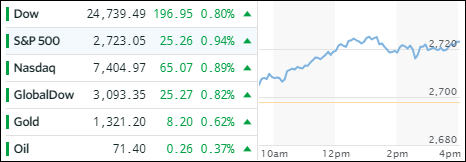
You never know what motivates traders to push the markets higher. After Trump’s withdrawal from the Iran nuclear pact, and massive preceding requests by world leaders not to follow through with it, you would have expected the markets to have hissy-fit. They did, but to the upside and with help of the VIX, which was spanked to the 13 level and thereby assisted the bulls to have it their way.

Technically speaking, the recent glass ceiling, namely the 50-day M/A of the S&P 500, was taken out today indicating that we may break out of the trading range I’ve been posting about. However, a little more work is needed to confirm that this was not a one day pony show.

Nothing seemed to be able to stop this rally, not even the fact that interest rates rose with the 10-year bond yield gaining 3 basis points to close at 3.00% on the money. Energy shares took top billing, but we saw broad based gains in financials, materials and technology sectors. Lagging on the day were telecoms and utilities.

Read More

Iran Nuclear Pact Ends—Major Indexes Unchanged

Ulli Market Commentary Contact

[Chart courtesy of MarketWatch.com]
  1. Moving the markets

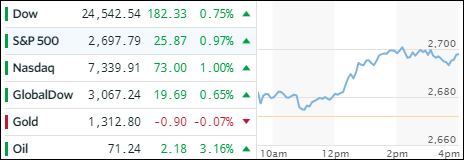
The much awaited and hyped up announcement by President Trump regarding the Iran nuclear pact had the major indexes, which hovered below their respective unchanged lines all morning, dipping down at first but managing to rebound to close essentially unchanged. Trump confirmed withdrawal from the pact and announced “the highest level of sanctions against Iran.”

While details were lacking, the markets pretty much took it in stride—so far—with most of the volatility occurring in the oil sector. The defense arena benefited as Israel bomb shelter headlines seem to play the drums of war. Domestically, Transportations lead with +0.76%, followed by Semiconductors and SmallCaps with +0.70% and +0.49% respectively.

Helping the markets gain some footing, after Trump’s announcement, was the VIX, which got pushed down to the 14 level thereby making sure that the Iran uncertainty supported the bulls and not the bears. Interest rates rose slightly with the 10-year bond yield creeping closer the 3% level, while the US Dollar (UUP) kept his recent strength alive by gaining +0.37%.

I don’t the market reaction to the Iran drama is over yet, and we’ll have to see how things play out over the next few days.

Read More

Trimming Early Gains

Ulli Market Commentary Contact

[Chart courtesy of MarketWatch.com]
  1. Moving the markets

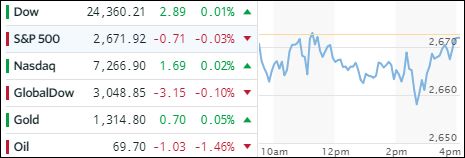
Last Friday’s winning ways continued this morning with the major indexes moving sideways but comfortably above the unchanged line. Then the Iran headlines appeared about Trump promising a decision tomorrow at 2 pm as to whether to de-certify the 2015 Iran nuclear pact and re-impose sanctions, which would hamper oil exports and interrupt the global supply chain.

That took the starch out of the rally and south we went, but the major indexes managed a green close. The S&P 500 dipped below its 200-day M/A on Friday but recovered and closed above it, while today, the index climbed above its 50-day M/A but closed below it. We’re still stuck in a wide sideways pattern, out of which we will eventually break out—either to the upside or to the downside.

Last week’s China trade headlines were in focus again, even though they resulted in no agreement after several days of talks other than Chinese news outlets reporting that “talks were positive” but more jawboning was needed to avoid a trade war. The markets were not affected, but this may change once the Trump/Iran deadline will have passed and other negative news reports become the main focus for the bears on Wall Street again.

Read More