
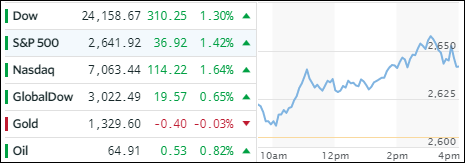
- Moving the markets
A solid and broad rally right after the opening bell pulled the major indexes out of the doldrums with the bulls finally managing to reduce some of the losses sustained not only in March but YTD as well. Today’s leaders were the dogs of the month, namely tech and energy.
We’ll have to wait and see if the recent spanking of company’s like Facebook, Tesla, Twitter and Amazon will fade into the background come April or will be brought back on the front burner. But there were other culprits as well that contributed to weakness in equities, and those issues are far from being over. Global trade war concerns and a new Fed chairman, not afraid to raise rates at an accelerated pace, combined to bring stock prices down from their euphoric levels reached in 2017 and may continue to do so.
In the end, volatility and investor confusion have reach new heights but nobody can actually accurately forecast how this next quarter will play out. That’s why I believe it’s best to stick with our Trend Tracking strategy, which allows us to keep our emotions in check by only following the direction of the major trend along with our trailing sell stops. These two indicators will serve as our guide to calmly make buy/sell decisions especially when the market heat is on. This prevents us from making irrational moves when the media’s “headline hockey” game reaches ridiculous levels.
- ETFs in the Spotlight
In case you missed the announcement and description of this section, you can read it here again.
It features 10 broadly diversified and sector ETFs from my HighVolume list as posted every Saturday. Furthermore, they are screened for the lowest MaxDD% number meaning they have been showing better resistance to temporary sell offs than all others over the past year.
The below table simply demonstrates the magnitude with which some of the ETFs are fluctuating in regards to their positions above or below their respective individual trend lines (%M/A). A break below, represented by a negative number, shows weakness, while a break above, represented by a positive percentage, shows strength.
For hundreds of ETF choices, be sure to reference Thursday’s StatSheet.
Year to date, here’s how our candidates have fared so far:
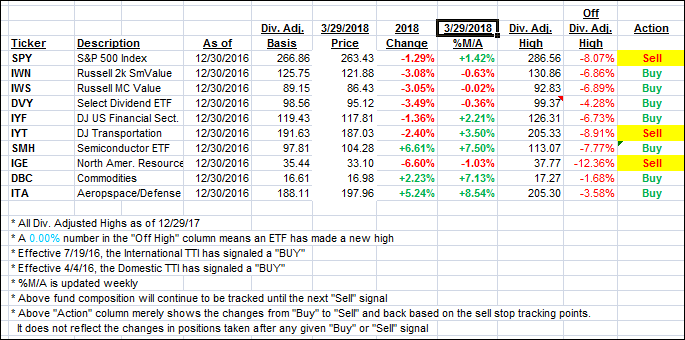
Again, the %M/A column above shows the position of the various ETFs in relation to their respective long term trend lines, while the trailing sell stops are being tracked in the “Off High” column. The “Action” column will signal a “Sell” once the -7.5% point has been taken out in the “Off High” column.
- Trend Tracking Indexes (TTIs)
Our Trend Tracking Indexes (TTIs) recovered with the indexes and headed north.
Here’s how we closed 3/29/2018:
Domestic TTI: +1.28% above its M/A (last close +0.97%)—Buy signal effective 4/4/2016
International TTI: +1.11% above its M/A (last close +0.33%)—Buy signal effective 7/19/2016
Disclosure: I am obliged to inform you that I, as well as my advisory clients, own some of the ETFs listed in the above table. Furthermore, they do not represent a specific investment recommendation for you, they merely show which ETFs from the universe I track are falling within the guidelines specified.
Contact Ulli