Tech Leads As Bull Run Continues

Ulli Market Commentary Contact

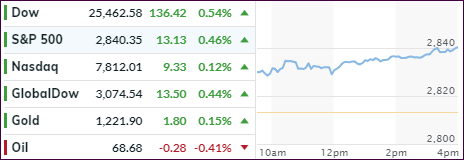
[Chart courtesy of MarketWatch.com]
  1. Moving the markets

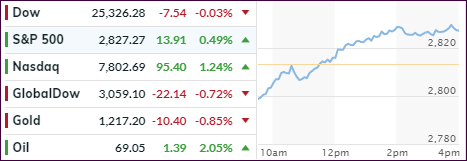
After a brief opening dip, the major indexes continued their ramp higher with the Nasdaq notching its 5th straight day of gains, as decent corporate earnings remained in focus. While our portfolio holdings have all gained in sync for the past 3 sessions, tech (QQQ) and consumer discretionaries (XLY), our latest additions, took top billing with +0.59% and +0.67% respectively.

The gains were not necessarily spectacular, but they have been solid and steady, which is preferable to fast and furious given the lofty levels of the indexes. For sure, the market’s more cautious advances were in part caused by the ever-lingering trade talks and the impact they will have long-term on the profitability of multi-national corporations.

Make no mistake, any upcoming retaliatory tariffs from trading partners will affect stock markets, especially once rhetoric is replaced by action. We saw that today, when weakness showed up in Germany, the European export powerhouse, where manufacturing orders plunged 4% in June, a clear sign that global trade disputes are leaving their mark.

While I appreciate any rally that comes our way, we also must be aware that most of the support comes from a few glamor stocks. In other words, the breadth is lacking, as you can see in this chart showing that the number of new highs is declining despite market advances.

Add to that the fact that economic data points have been shaky at best and disappointing at worst (real estate), which makes it even more amazing that the Nasdaq manages to ignore, so far, some of these realities as this chart shows. Which leaves me pondering “how long can that go on?”
Read More

ETFs On The Cutline – Updated Through 08/03/2018

Ulli ETFs on the Cutline Contact

Below, please find the latest High Volume ETFs Cutline report, which shows how far above or below their respective long-term trend lines (39 week SMA) my currently tracked ETFs are positioned.

This report covers the HV ETF Master List from Thursday’s StatSheet and includes 366 High Volume ETFs ETFs, defined as those with an average daily volume of more than $5 million, of which currently 175 (last week 175) are hovering in bullish territory. The yellow line separates those ETFs that are positioned above their trend line (%M/A) from those that have dropped below it.

Take a look:

The HV ETF Master Cutline Report

In case you are not familiar with some of the terminology used in the reports, please read the Glossary of Terms.

If you missed the original post about the Cutline approach, you can read it here.

ETF Tracker Newsletter For August 3, 2018

Ulli ETF Tracker Contact

ETF Tracker StatSheet

https://theetfbully.com/2018/08/weekly-statsheet-for-the-etf-tracker-newsletter-updated-through-08-02-2018/

 EARNINGS OVERCOME WEAK JOBS REPORT

[Chart courtesy of MarketWatch.com]
  1. Moving the markets

Solid earnings reports throughout the week proved to be good enough to shake off any market weakness caused by tariff uncertainties and a so-so July employment report. In terms of trade spats, China has threatened to retaliate with tariffs on $60 billion in US goods after Trump threw down the gauntlet yesterday. As I said, this will be a long movie…

The major indexes gained in a broad rebound with 10 of the S&P’s 11 sectors closing higher led by consumer staples (XLP). The Nasdaq managed to eke out a 1% gain for the week, after two weeks of losses, mainly due to Apple’s performance.

Taking center stage today was the jobs report, which disappointed when looking at the actual jobs gained (157k) vs. an expected 193k number. There were two specific reasons for this with Toys “R” US contributing some 31k jobs to the decline, while school vacation timing resulted in another 40k jobs lost, according SouthBay Research. Otherwise, there was broad consumer strength.

The risk to trade wars remains, but it appears that worst case scenarios have been priced in the markets for the time being. That also means, should the rhetoric slow down and a resolution with China is put on the negotiating table, you might see the markets take off and make a run for the old highs.

Read More

Weekly StatSheet For The ETF Tracker Newsletter – Updated Through 08/02/2018

Ulli ETF StatSheet Contact

ETF Data updated through Thursday, August 2, 2018

Methodology/Use of this StatSheet:

  1. From the universe of over 1,800 ETFs, I have selected only those with a trading volume of over $5 million per day (HV ETFs), so that liquidity and a small bid/ask spread are assured.
  2. Trend Tracking Indexes (TTIs)

Buy or Sell decisions for Domestic and International ETFs (section 1 and 2), are made based on the respective TTI and its position either above or below its long-term M/A (Moving Average). A crossing of the trend line from below accompanied by some staying power above constitutes a “Buy” signal. Conversely, a clear break below the line constitutes a “Sell” signal. Additionally, I use a 7.5% trailing stop loss on all positions in these categories to control downside risk.

  1. All other investment arenas do not have a TTI and should be traded based on the position of the individual ETF relative to its own respective trend line (%M/A). That’s why those signals are referred to as a “Selective Buy.” In other words, if an ETF crosses its own trendline to the upside, a “Buy” signal is generated. Since these areas tend to be more volatile, I recommend a wider trailing sell stop of 7.5% -10% depending on your risk tolerance.

If you are unfamiliar with some of the terminology, please see Glossary of Terms and new subscriber information in section 9.


  1. DOMESTIC EQUITY ETFs: BUY — since 4/4/2016

Click on chart to enlarge

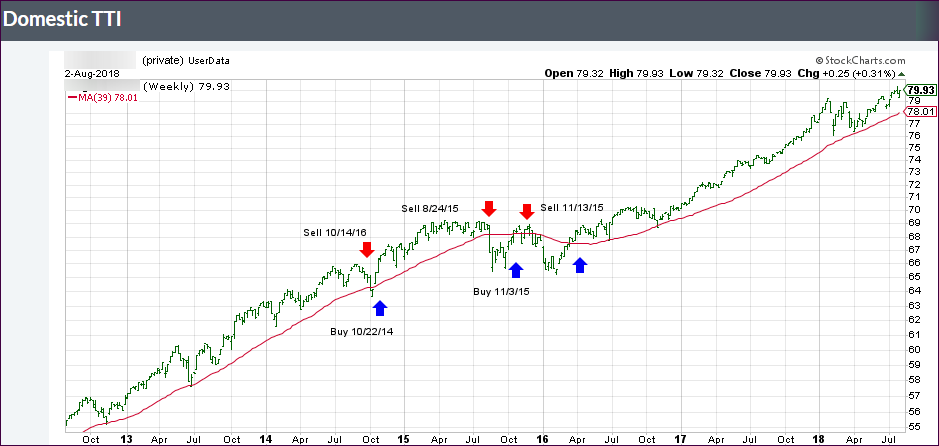
Our main directional indicator, the Domestic Trend Tracking Index (TTI-green line in the above chart) is positioned above its long-term trend line (red) by +2.59% after having generated a new Domestic Buy signal effective 4/4/2016 as posted.

Read More

Apple Saves The Day

Ulli Market Commentary Contact

[Chart courtesy of MarketWatch.com]
  1. Moving the markets

With no adverse trade news making the headlines, it was Apple’s (AAPL) day to shine as it not only lifted the indexes but also managed to become the first $1 trillion company—ever.

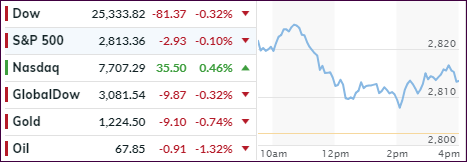
The S&P 500 and the Nasdaq gained solidly after a slow start at the opening, but then rocketed higher without looking back. Despite Apple’s valiant effort to support the markets, it just fell a tad short of pushing the Dow into the green. Nevertheless, the Dow’s comeback from -240 points at the opening to almost unchanged sure qualifies as a “rally” as well.

Apple’s run came on the heels of a strong earnings report, along with an upbeat outlook, which even pushed trade concerns to the back burner, at least for the moment. Not to worry, those will be back as a response to Trump’s tariff increase from 10% to 25% will sure be forthcoming.

Speaking of tariff threats and sanctions, at least for today, the scene shifted to Turkey where the Lira tumbled to record lows while in China the Yuan took another steep plunge (as did their stocks). That makes me wonder if Trump’s latest increase to 25% need to be higher to compensate for the latest Yuan devaluation?

I am being facetious, of course, but it looks that this movie is far from being over, and the battles will continue unabated. This leaves me pondering the obvious question: “How long will it take until the US markets will be affected?”

Read More

An Early Rally Fizzles But Tech Gains

Ulli Market Commentary Contact

[Chart courtesy of MarketWatch.com]
  1. Moving the markets

There was some afterglow this morning with the major indexes storming into positive territory on the heels of Apple’s blow out earnings report, which was released yesterday afternoon.

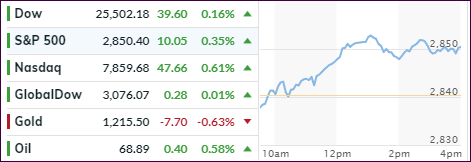
However, the initial euphoria was short-lived and faded as reality set in via a variety of events pushing 2 of the 3 indexes back into the red. The Nasdaq stayed above its unchanged line only due to Apple’s strong performance.

The Fed confirmed via its FOMC statement that the economy remains strong and that 2 more rate hikes were in store for 2018. Bonds reacted, and the 10-year yield advanced 4 basis points and closed right on its overhead glass ceiling of 3%. It sure looks like that the high of this year (3.11%) will be taken out shortly.

Despite the Fed’s jawboning about a “strong” economy, US manufacturing did a 180 by slumping to its weakest this year with prices surging and orders tumbling. I guess it’s all in the earnings. With 80% of the S&P stocks having reported better-than-expected second quarter earnings, which is well above the historical average of 67%, nothing else matters.

But, the bullish spirits were dampened somewhat by the ongoing trade differences between the US and China. Trump has now upped the ante to propose raising tariffs on $200 billion worth of Chinese products not by 10%, as previously announced, but 25%.

I can’t wait for the rebuttal. If it’s big enough, it sure will have a market moving effect the bears will like.

Read More