
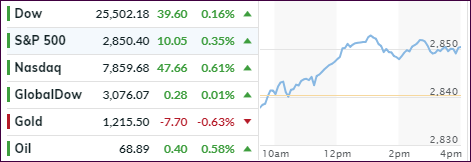
- Moving the markets
After a brief opening dip, the major indexes continued their ramp higher with the Nasdaq notching its 5th straight day of gains, as decent corporate earnings remained in focus. While our portfolio holdings have all gained in sync for the past 3 sessions, tech (QQQ) and consumer discretionaries (XLY), our latest additions, took top billing with +0.59% and +0.67% respectively.
The gains were not necessarily spectacular, but they have been solid and steady, which is preferable to fast and furious given the lofty levels of the indexes. For sure, the market’s more cautious advances were in part caused by the ever-lingering trade talks and the impact they will have long-term on the profitability of multi-national corporations.
Make no mistake, any upcoming retaliatory tariffs from trading partners will affect stock markets, especially once rhetoric is replaced by action. We saw that today, when weakness showed up in Germany, the European export powerhouse, where manufacturing orders plunged 4% in June, a clear sign that global trade disputes are leaving their mark.
While I appreciate any rally that comes our way, we also must be aware that most of the support comes from a few glamor stocks. In other words, the breadth is lacking, as you can see in this chart showing that the number of new highs is declining despite market advances.
Add to that the fact that economic data points have been shaky at best and disappointing at worst (real estate), which makes it even more amazing that the Nasdaq manages to ignore, so far, some of these realities as this chart shows. Which leaves me pondering “how long can that go on?”
- ETFs in the Spotlight
In case you missed the announcement and description of this section, you can read it here again.
It features 10 broadly diversified and sector ETFs from my HighVolume list as posted every Saturday. Furthermore, they are screened for the lowest MaxDD% number meaning they have been showing better resistance to temporary sell offs than all others over the past year.
The below table simply demonstrates the magnitude with which some of the ETFs are fluctuating regarding their positions above or below their respective individual trend lines (%M/A). A break below, represented by a negative number, shows weakness, while a break above, represented by a positive percentage, shows strength.
For hundreds of ETF choices, be sure to reference Thursday’s StatSheet.
Year to date, here’s how our candidates have fared so far:
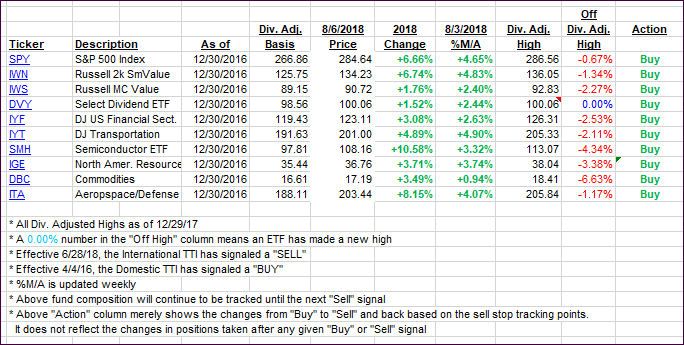
Again, the %M/A column above shows the position of the various ETFs in relation to their respective long-term trend lines, while the trailing sell stops are being tracked in the “Off High” column. The “Action” column will signal a “Sell” once the -8% point has been taken out in the “Off High” column. For more volatile sector ETFs, the trigger point is -10%.
- Trend Tracking Indexes (TTIs)
Our Trend Tracking Indexes (TTIs) were mixed.
Here’s how we closed 08/06/2018:
Domestic TTI: +2.75% above its M/A (last close +2.52%)—Buy signal effective 4/4/2016
International TTI: +0.47% above its M/A (last close +0.50%)—Buy signal effective 7/26/2018
Disclosure: I am obliged to inform you that I, as well as my advisory clients, own some of the ETFs listed in the above table. Furthermore, they do not represent a specific investment recommendation for you, they merely show which ETFs from the universe I track are falling within the guidelines specified.
Contact Ulli