
- Moving the markets
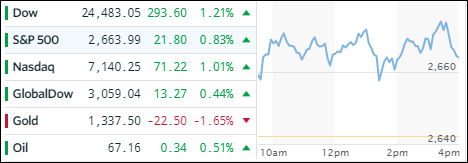
The tug-of-war continued today as talk, that a strike on Syria may not be immediately in the cards, de-escalated tensions and giving a bullish assist to equities. The 3 major indexes scored solid gains after yesterday’s losses.
Six out of the eleven primary S&P sectors gained led by Financials (XLF +1.75%) with Semiconductors (SMH +1.66%) taking second place.
While geopolitical concerns took center stage, Trump’s rhetoric softened from Wednesday’s “get ready Russia,” to Thursday’s “never said when an attack on Syria would take place. Could be very soon or not so soon at all!” In other words, he said absolutely nothing.
Besides the war mongering atmosphere, the markets still have trade sanctions with China to deal with and the upcoming earnings season, which is expected to be strong. In the meantime, the S&P has been dancing around its 200-day M/A successfully so far but has been trending sideways in a broad range.
In other words, we have some positives, negatives and a bunch of uncertainty, either of which will be able to affect market direction on any given day, hence the roller coaster environment. Should the negative factors overwhelm the positive ones, we may very well see our Trend Tracking Indexes (TTI) head south again, but it remains to be seen whether that downside momentum strengthens to a point where all-out “Sell” signals are being generated.
Stay tuned!
- ETFs in the Spotlight
In case you missed the announcement and description of this section, you can read it here again.
It features 10 broadly diversified and sector ETFs from my HighVolume list as posted every Saturday. Furthermore, they are screened for the lowest MaxDD% number meaning they have been showing better resistance to temporary sell offs than all others over the past year.
The below table simply demonstrates the magnitude with which some of the ETFs are fluctuating in regards to their positions above or below their respective individual trend lines (%M/A). A break below, represented by a negative number, shows weakness, while a break above, represented by a positive percentage, shows strength.
For hundreds of ETF choices, be sure to reference Thursday’s StatSheet.
Year to date, here’s how our candidates have fared so far:
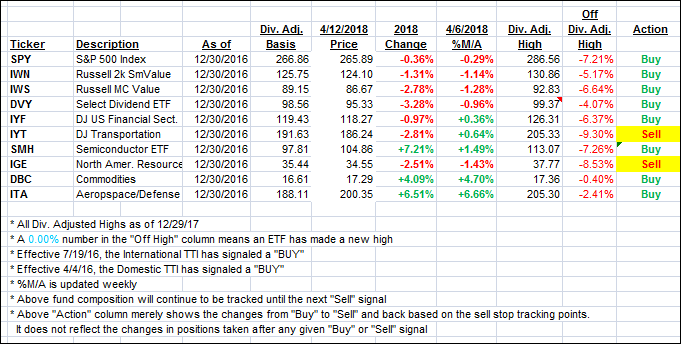
Again, the %M/A column above shows the position of the various ETFs in relation to their respective long term trend lines, while the trailing sell stops are being tracked in the “Off High” column. The “Action” column will signal a “Sell” once the -7.5% point has been taken out in the “Off High” column.
- Trend Tracking Indexes (TTIs)
Our Trend Tracking Indexes (TTIs) headed north as the mood on Wall Street was bullish.
Here’s how we closed 4/12/2018:
Domestic TTI: +1.48% above its M/A (last close +1.22%)—Buy signal effective 4/4/2016
International TTI: +2.11% below its M/A (last close +1.73%)—Buy signal effective 7/19/2016
Disclosure: I am obliged to inform you that I, as well as my advisory clients, own some of the ETFs listed in the above table. Furthermore, they do not represent a specific investment recommendation for you, they merely show which ETFs from the universe I track are falling within the guidelines specified.
Contact Ulli