
- Moving the markets
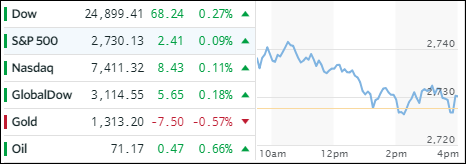
Despite the Dow sporting an 8-day winning streak, an early rally fizzled into the close with the major indexes barely hanging on above their respective unchanged lines. The gains were modest with the leader being energy and health care, while real estate, telecommunications and industrials lagged.
Today’s rally was supported by the perception that trade issues with China may be resolved as new talks are scheduled for this week. President Trump was working with the Chinese Premier to find a solution to keep the Chinese telecom giant ZTE from going out of business as a result of previous sanctions. I guess Wall Street sees the possibility of improved relations when “one hand washes the other.”
While optimism over the recent earnings season reigns supreme, the fly in the ointment continues to be higher interest rates with the 10-year bond yield rising again and closing at the psychologically important 3% level. Last time this occurred (middle of April), the S&P 500 took a 100 point dive. It’ll be interesting to see if this glass ceiling holds again or if equities can overcome this resistance point and rally higher.
- ETFs in the Spotlight
In case you missed the announcement and description of this section, you can read it here again.
It features 10 broadly diversified and sector ETFs from my HighVolume list as posted every Saturday. Furthermore, they are screened for the lowest MaxDD% number meaning they have been showing better resistance to temporary sell offs than all others over the past year.
The below table simply demonstrates the magnitude with which some of the ETFs are fluctuating in regards to their positions above or below their respective individual trend lines (%M/A). A break below, represented by a negative number, shows weakness, while a break above, represented by a positive percentage, shows strength.
For hundreds of ETF choices, be sure to reference Thursday’s StatSheet.
Year to date, here’s how our candidates have fared so far:
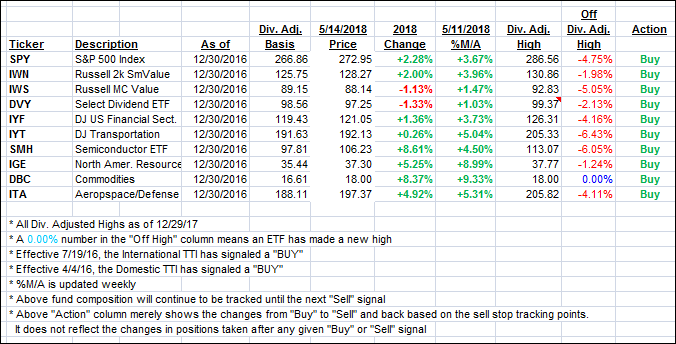
Again, the %M/A column above shows the position of the various ETFs in relation to their respective long term trend lines, while the trailing sell stops are being tracked in the “Off High” column. The “Action” column will signal a “Sell” once the -7.5% point has been taken out in the “Off High” column.
- Trend Tracking Indexes (TTIs)
Our Trend Tracking Indexes (TTIs) barely moved as the markets ended up flat.
Here’s how we closed 05/14/2018:
Domestic TTI: +2.05% above its M/A (last close +2.07%)—Buy signal effective 4/4/2016
International TTI: +2.93% below its M/A (last close +2.90%)—Buy signal effective 7/19/2016
Disclosure: I am obliged to inform you that I, as well as my advisory clients, own some of the ETFs listed in the above table. Furthermore, they do not represent a specific investment recommendation for you, they merely show which ETFs from the universe I track are falling within the guidelines specified.
Contact Ulli