Trade War Disputes Return With A Vengeance

Ulli Market Commentary Contact

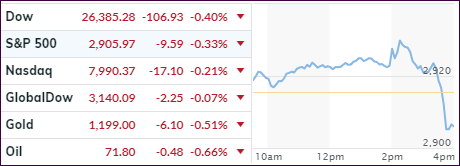
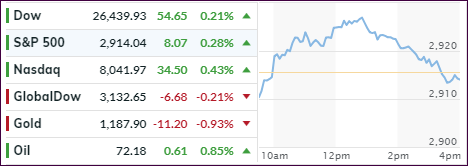
[Chart courtesy of MarketWatch.com]
  1. Moving the markets

The 4-day winning streak for US equities came to a sudden halt this morning with the major indexes taking a steep dive, as trade-war jitters returned to front-and-center with Trump announcing new tariffs on Chinese goods. After days of calm, which allowed the stock markets to make a nice run, reality set in with fears mounting that a full-on trade war might be a distinct possibility.

The latest was an announcement by the White House that it is examining slapping 10% tariffs on another $200 billion of Chinese goods, which sends a clear message that the US is willing to take the dispute to the next level. Given the ever-increasing level of hostility, it’s hard to make a case how a full-blown trade war can be avoided and with it the economic consequences.

There was no place to hide, as red numbers dominated throughout most parts of the world. Looking at my favorite chart again, it seems that stocks will have a long way to go to catch down to the reality of the bond markets. The odd man out was the US Dollar, which spiked to levels last seen on the 4th of July.

Commodities were hammered and crashed the most in 4 years to a new record low, in part caused by the CME having difficulties with their data streams. Copper got clubbed like a baby seal while Crude Oil simply collapsed.

Our International TTI, which had just climbed back above its trend line 2 days ago, succumbed to selling pressure and slipped back below it, which confirms our current “Sell” signal to be out of that market.

It remains to be seen whether today’s activity was just an aberration or the beginning of more downside momentum to come. Either way, volatility is sure to be our constant companion.

Read More

Continuing The Bullish Theme

Ulli Market Commentary Contact

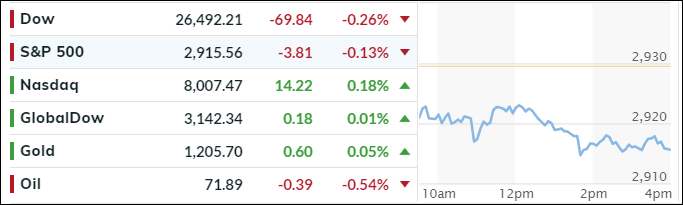
[Chart courtesy of MarketWatch.com]
  1. Moving the markets

The bullish mood continued with the Dow and the S&P 500 making solid gains, while the Nasdaq lagged and barely stayed above the unchanged line. The Dow had its best win streak in the past 30 days, while the S&P 500 was homing in on a new 5-month high.

However, when looking at the bigger picture, the markets were mixed, if you take out the Dow and S&P 500. SmallCaps, despite being a top YTD performer, lagged and so did Transportations while, as mentioned above, the Nasdaq ended barely changed after making a record intra-day high.

This is now the fourth straight finish solidly in the green, as concerns over global trade disputes have clearly shifted with most of the focus now being on the upcoming second quarter earnings season, while newfound optimism over recent positive economic data points gave a much needed assist. One can only hope that recent trade tensions remain in the background.

I think we’ll find out quick if they will remain subdued, or if they suddenly make their make their presence felt by pulling some of the exuberance out of the markets.

Read More

Bulls In Charge

Ulli Market Commentary Contact

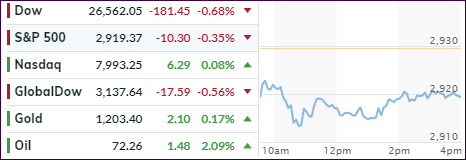
[Chart courtesy of MarketWatch.com]
  1. Moving the markets

The bulls were clearly in charge with the major indexes jumping right after the opening bell and remaining solidly above the unchanged line. The Dow shook off some of its recent weakness by scoring a triple digit gain and notching a third straight winning session, which put it back to slightly positive (+0.2%) for the year.

With 2/3 of economic activity coming from consumers to buy things they don’t need with money they don’t have, the Fed was delighted to present data showing that total consumer credit increased 7.6%, the fastest pace of credit growth since November. This came on top of Friday’s stronger than expected jobs report and assisted this euphoric rally, while, at least for the moment, any trade war anxieties were brushed aside.

As a result, two of the more depressed sectors showed signs of life, namely industrials and financials, which led the way to higher prices. This caused bond yields to climb with the 10-year adding 4 basis points to end the day at 2.86%.

As I posted last week, bond yields and the S&P 500 remain out of sync, as this chart shows. They will eventually align, but there is no hard and fast rule as to how soon this will occur. We may very well see more upside momentum before some of this exuberance will dissipate.

Read More

ETFs On The Cutline – Updated Through 07/06/2018

Ulli ETFs on the Cutline Contact

Below please find the latest High Volume ETFs Cutline report, which shows how far above or below their respective long-term trend lines (39 week SMA) my currently tracked ETFs are positioned.

This report covers the HV ETF Master List from Thursday’s StatSheet and includes 366 High Volume ETFs ETFs, defined as those with an average daily volume of more than $5 million, of which currently 146 (last week 119) are hovering in bullish territory. The yellow line separates those ETFs that are positioned above their trend line (%M/A) from those that have dropped below it.

Take a look:

The HV ETF Master Cutline Report

In case you are not familiar with some of the terminology used in the reports, please read the Glossary of Terms.

If you missed the original post about the Cutline approach, you can read it here.

ETF Tracker Newsletter For July 6, 2018

Ulli ETF Tracker, Uncategorized Contact

ETF Tracker StatSheet

https://theetfbully.com/2018/07/weekly-statsheet-for-the-etf-tracker-newsletter-updated-through-07-05-2018/

 ENDING THE WEEK WITH SOLID GAINS

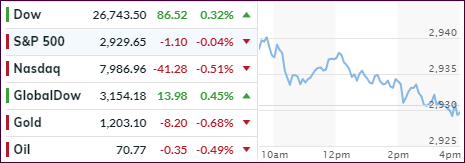
[Chart courtesy of MarketWatch.com]
  1. Moving the markets

Despite this being a Holiday shortened week, the major indexes managed to eke out some solid gains supported by a better than expected jobs report, as the economy created 213k new jobs in June. That was better than the hoped for 200k number. Also, the readings for May and April were revised higher.

Imagine these numbers being an overriding factor in market direction when considering that the gauntlet has been thrown, as this Friday marked day 1 when the “largest scale trade war in economic history” was launched. Duties on $34 billion in tariffs of Chines exports started at 12:01 AM this morning.

Quipped Zero Hedge:

If Small Caps are up 3% in a week when Trump unleashes $34 billion in tariffs on China, imagine how much it will be up when he brings the full weight of his planned $500 billion tariffs…

Things are clearly out of whack, as bond yields are disconnected from the level of stocks, as this chart shows. It brings up the usual question: Will bond yields rise to meet S&P levels, or will it be the other way around? Just remember, when it comes to economic reality, bonds are way ahead of stocks.

As I said earlier in the week, these 4 trading days may cause some volatility with most traders being out for the Holiday. We should see on Monday whether this rally has legs or was simply a result of low volume trading when markets can be easier manipulated.

Read More

Weekly StatSheet For The ETF Tracker Newsletter – Updated Through 07/05/2018

Ulli Uncategorized Contact

ETF Data updated through Thursday, July 5, 2018

Methodology/Use of this StatSheet:

  1. From the universe of over 1,800 ETFs, I have selected only those with a trading volume of over $5 million per day (HV ETFs), so that liquidity and a small bid/ask spread are assured.
  2. Trend Tracking Indexes (TTIs)

Buy or Sell decisions for Domestic and International ETFs (section 1 and 2), are made based on the respective TTI and its position either above or below its long-term M/A (Moving Average). A crossing of the trend line from below accompanied by some staying power above constitutes a “Buy” signal. Conversely, a clear break below the line constitutes a “Sell” signal. Additionally, I use a 7.5% trailing stop loss on all positions in these categories to control downside risk.

  1. All other investment arenas do not have a TTI and should be traded based on the position of the individual ETF relative to its own respective trend line (%M/A). That’s why those signals are referred to as a “Selective Buy.” In other words, if an ETF crosses its own trendline to the upside, a “Buy” signal is generated. Since these areas tend to be more volatile, I recommend a wider trailing sell stop of 7.5% -10% depending on your risk tolerance.

If you are unfamiliar with some of the terminology, please see Glossary of Terms and new subscriber information in section 9.


  1. DOMESTIC EQUITY ETFs: BUY — since 4/4/2016

Click on chart to enlarge

Our main directional indicator, the Domestic Trend Tracking Index (TTI-green line in the above chart) is positioned above its long-term trend line (red) by +1.78% after having generated a new Domestic Buy signal effective 4/4/2016 as posted.

Read More