
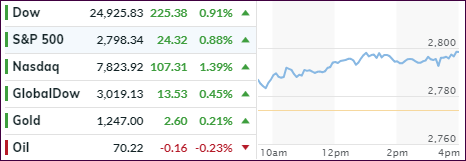
- Moving the markets
Yesterday’s market dump turned into today’s market pump with the major indexes recovering as a tech led rally pushed the Nasdaq to a record close.
What changed from yesterday?
Not much, other than that sentiment took a turn for the better following news reports that the US and China are working to ease tensions via the resumption of trade talks. That helped to propel the markets higher in line with the recent “trade wars on, trade wars off” theme, which either helped or hurt the indexes depending on which was more prevalent on any given day.
At the same time, we may be seeing a new tug-of-war in the making, namely “trade war vs. earnings” with some Wall Street traders opining that the trade disputes will move to the back burner once the highly anticipated earnings season gets into full gear over the next 2 weeks, that it will overshadow all other concerns.
Maybe so, but earnings expectations are high with strong growth for profits and revenue to be a given. The uncertain part, however, is this one: Will companies continue with their history of topping analysts’ expectations by such large numbers as in the recent past? If they don’t, it certainly could cause disappointment and, given current high market evaluations, anything less than perfection may give way to bearish sentiment.
In the meantime, the roller coaster ride is bound to continue…
- ETFs in the Spotlight
In case you missed the announcement and description of this section, you can read it here again.
It features 10 broadly diversified and sector ETFs from my HighVolume list as posted every Saturday. Furthermore, they are screened for the lowest MaxDD% number meaning they have been showing better resistance to temporary sell offs than all others over the past year.
The below table simply demonstrates the magnitude with which some of the ETFs are fluctuating regarding their positions above or below their respective individual trend lines (%M/A). A break below, represented by a negative number, shows weakness, while a break above, represented by a positive percentage, shows strength.
For hundreds of ETF choices, be sure to reference Thursday’s StatSheet.
Year to date, here’s how our candidates have fared so far:
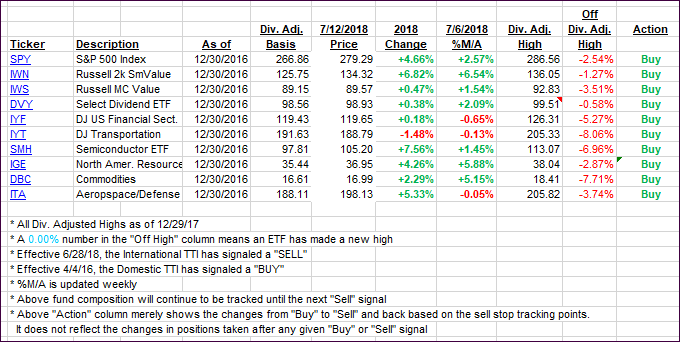
Again, the %M/A column above shows the position of the various ETFs in relation to their respective long-term trend lines, while the trailing sell stops are being tracked in the “Off High” column. The “Action” column will signal a “Sell” once the -7.5% point has been taken out in the “Off High” column.
- Trend Tracking Indexes (TTIs)
Our Trend Tracking Indexes (TTIs) picked up steam with the overall bullish theme of the day. The International one edge back above its long-term trend line by a fraction of a percent, which is too tiny of a move to draw any conclusions.
Here’s how we closed 07/12/2018:
Domestic TTI: +2.75% above its M/A (last close +2.33%)—Buy signal effective 4/4/2016
International TTI: +0.10% above its M/A (last close -0.49%)—Sell signal effective 6/28/2018
Disclosure: I am obliged to inform you that I, as well as my advisory clients, own some of the ETFs listed in the above table. Furthermore, they do not represent a specific investment recommendation for you, they merely show which ETFs from the universe I track are falling within the guidelines specified.
Contact Ulli