
- Moving the markets
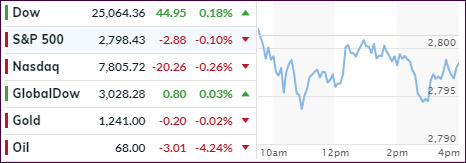
The markets meandered aimlessly with the major indexes showing a mixed picture as the S&P 500 and Nasdaq pulled back while the Dow managed to stay above the unchanged line.
Presidents Trump and Putin met as planned in Helsinki, but even a joint conference did not motivate buyers to pile into equities. In other words, the meeting of the world leaders was a non-event as far as markets was concerned.
Of course, the focus on Wall Street is the upcoming earnings season which, for the time being, seems to overshadow all other events. So far, we’ve only had a couple of banks reporting, and traders are homing in on fundamentals, which to some signals strong domestic activity.
Of course, there is always the elephant in the room named “trade news,” which at any time could interrupt supporting equity moves to the upside. As I am writing this, Monday afternoon, the first fly in the ointment appeared as Netflix’s stock plunged some 13% with subscriber growth slowing and cash burn soaring.
We all like to know what will happen next in the markets. Will there be a summer rally or will disappointment reign? Cycles can at times predict, with various degrees of certainty, as to what happens next. Of course, nothing is ever 100%, but this chart looks interesting.
This summer appears to be anything but boring.
- ETFs in the Spotlight
In case you missed the announcement and description of this section, you can read it here again.
It features 10 broadly diversified and sector ETFs from my HighVolume list as posted every Saturday. Furthermore, they are screened for the lowest MaxDD% number meaning they have been showing better resistance to temporary sell offs than all others over the past year.
The below table simply demonstrates the magnitude with which some of the ETFs are fluctuating regarding their positions above or below their respective individual trend lines (%M/A). A break below, represented by a negative number, shows weakness, while a break above, represented by a positive percentage, shows strength.
For hundreds of ETF choices, be sure to reference Thursday’s StatSheet.
Year to date, here’s how our candidates have fared so far:
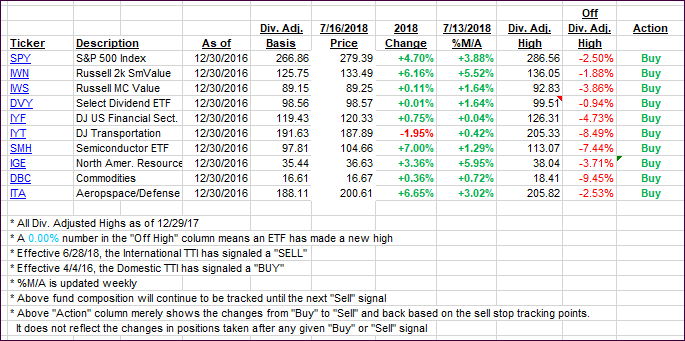
Again, the %M/A column above shows the position of the various ETFs in relation to their respective long-term trend lines, while the trailing sell stops are being tracked in the “Off High” column. The “Action” column will signal a “Sell” once the -7.5% point has been taken out in the “Off High” column.
- Trend Tracking Indexes (TTIs)
Our Trend Tracking Indexes (TTIs) both slipped. Again, the International one is still positioned in no-man’s land, and I will not issue a new “Buy” cycle until this indicator has clearly broken above its long-term trend line and shown some staying power. This cautious approach is designed to avoid a potential whip-saw signal.
Here’s how we closed 07/16/2018:
Domestic TTI: +2.57% above its M/A (last close +2.69%)—Buy signal effective 4/4/2016
International TTI: +0.14% above its M/A (last close +0.28%)—Sell signal effective 6/28/2018
Disclosure: I am obliged to inform you that I, as well as my advisory clients, own some of the ETFs listed in the above table. Furthermore, they do not represent a specific investment recommendation for you, they merely show which ETFs from the universe I track are falling within the guidelines specified.
Contact Ulli