- Moving the markets
You would have expected the markets to show some signs of life with Apple posting better than expected earnings and revenue after the close yesterday. Or, that the Fed’s statement was interpreted as somewhat dovish despite saying that further rate hikes are “needed in the coming months.”
If you thought that, you were wrong. Maybe it was because Apple’s glowing report card was simply a result of some $22.88 billion in buybacks of its own shares in Q1 along with doling out another $3.2 billion in dividends. To put this in perspective, according to ZH, the amount of stock bought back by Apple is larger than the market cap of 275 of the 500 companies in the S&P 500 index.
Or, maybe confusion reigned supreme when the Fed statement mentioned the words “symmetric inflation objective,” and traders and algos alike had to scramble to figure out what that meant.
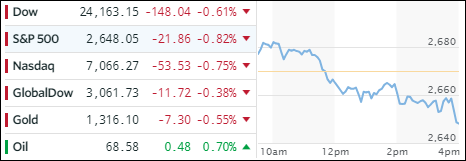
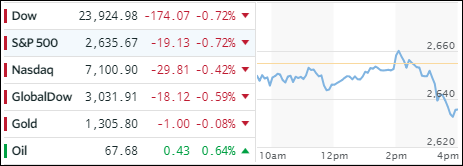
Be that as it may, in times of uncertainty, the markets tend to take the way of least resistance, which is down. That’s what happened, and the major indexes headed south and closed near their lows of the day.
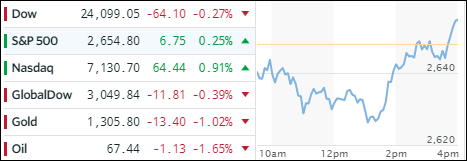
Interest rates were mixed with the 10-year bond yield remaining unchanged at 2.97%. Having a wild day was the US Dollar (UUP), which dumped sharply and then recovered to rally +0.45%.
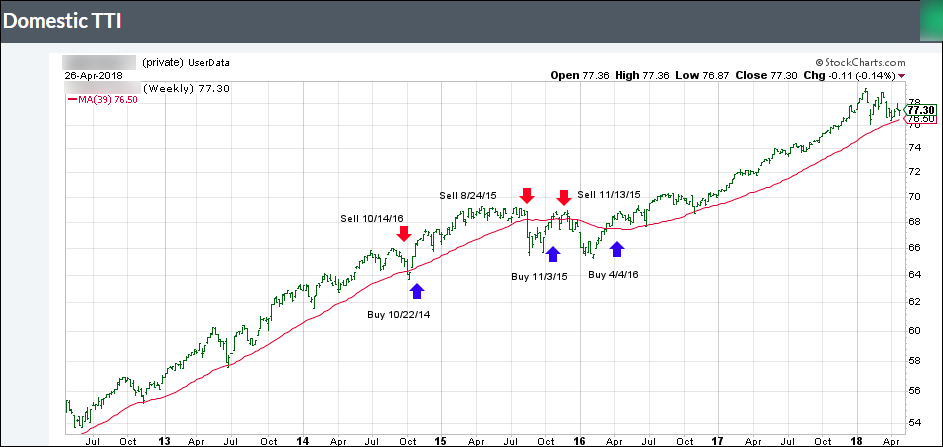
This turned out to be another session that pushed our Trend Tracking Indexes (TTIs) closer to a potential “Sell” signal. Please see section 3 below for the exact details.