Weekly StatSheet For The ETF Tracker Newsletter – Updated Through 08/09/2018

Ulli ETF StatSheet Contact

ETF Data updated through Thursday, August 9, 2018

Methodology/Use of this StatSheet:

  1. From the universe of over 1,800 ETFs, I have selected only those with a trading volume of over $5 million per day (HV ETFs), so that liquidity and a small bid/ask spread are assured.
  2. Trend Tracking Indexes (TTIs)

Buy or Sell decisions for Domestic and International ETFs (section 1 and 2), are made based on the respective TTI and its position either above or below its long-term M/A (Moving Average). A crossing of the trend line from below accompanied by some staying power above constitutes a “Buy” signal. Conversely, a clear break below the line constitutes a “Sell” signal. Additionally, I use a 7.5% trailing stop loss on all positions in these categories to control downside risk.

  1. All other investment arenas do not have a TTI and should be traded based on the position of the individual ETF relative to its own respective trend line (%M/A). That’s why those signals are referred to as a “Selective Buy.” In other words, if an ETF crosses its own trendline to the upside, a “Buy” signal is generated. Since these areas tend to be more volatile, I recommend a wider trailing sell stop of 7.5% -10% depending on your risk tolerance.

If you are unfamiliar with some of the terminology, please see Glossary of Terms and new subscriber information in section 9.


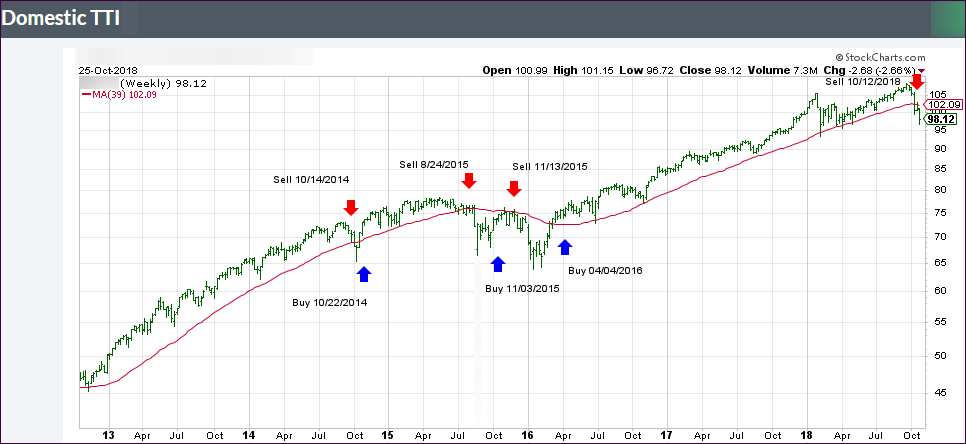
  1. DOMESTIC EQUITY ETFs: BUY — since 4/4/2016

Click on chart to enlarge

Our main directional indicator, the Domestic Trend Tracking Index (TTI-green line in the above chart) is positioned above its long-term trend line (red) by +2.94% after having generated a new Domestic Buy signal effective 4/4/2016 as posted.

Read More

See-Sawing Through The Session

Ulli Market Commentary Contact

[Chart courtesy of MarketWatch.com]
  1. Moving the markets

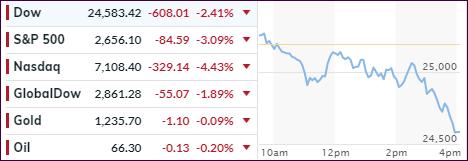
In a repeat from yesterday, the Nasdaq managed to eke out another win, although only by the tiniest of margins, which was enough to log in its 8th straight gain, its best streak since October. The broader market see-sawed all day and ended up diving into the close registering small losses.

Looking at the chart above, it seems apparent that the tug-of-war continued. On one side, we have solid earnings with the number of companies beating estimates being a the highest since 2009, according to JP Morgan.

On the other side, and I hate to have to repeat myself, are the lingering trade tensions between the US and China, where the latest news headline creates either a bullish or bearish effect on market direction causing the see-saw outcome we witnessed today.

The latest economic data were inconsequential with initial jobless claims falling more than expected, while the July producer index (PPI) was flat with expectations calling for a +0.2% rise. That helped bond yields to pull back with the 10-year dropping 3 basis points to 2.93%.

With the focus having been on earnings and interest rates here in the US, I don’t think that the domestic equity markets have priced in any long-term consequences of a prolonged trade war with China, reeling emerging markets and European banking problems. These are all issues that could provide a hefty headwind soon but, for right now, everything seems to be looked at through rose colored glasses.

Read More

Nasdaq Bucks The Trend

Ulli Market Commentary Contact

[Chart courtesy of MarketWatch.com]
  1. Moving the markets

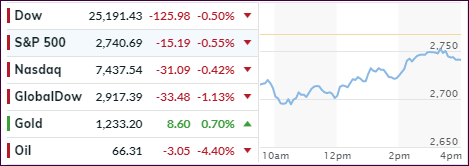
It was more-or-less a consolidation day with 2 of the 3 major indexes scoring fractional losses, while the Nasdaq managed to buck the trend to nowhere by closing in the green and thereby attaining its longest win streak (7 days) in about 5 months.

However, more trade disputes between the US and China, along with a bunch of weak earnings results (Disney, Snap) weakened markets, but the impact was not strong enough to disrupt the positive effect of the overall earnings season, which has been the primary driver supporting the bullish case.

Interest rates lived in a world of their own and did something that I have never seen before—namely nothing. A look at this table left me simply amazed at the odds of all bond yields being left unchanged at the end of the day.

Maybe it’s a precursor of markets transitioning into their slowest summer trading period, where fewer traders can easily push the indexes around, which is why I expect the Nasdaq and S&P 500 to break out to new highs. In the case of the S&P, that would be a move of about +0.5%.

Read More

A Sea Of Green In Equities

Ulli Market Commentary Contact

[Chart courtesy of MarketWatch.com]
  1. Moving the markets

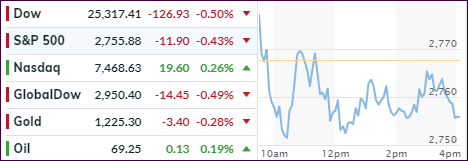
At least for today, earnings were enough of a positive to beat anxiety over trade war fears with the major indexes continuing their bullish run, reinforced by the S&P companies showing earnings growth of 24% and sales gains of 9.8%.

As MarketWatch put it: “Strong earnings have helped bolster the belief that steady US economic growth will continue to support corporate bottom lines and keep stocks buoyant.”

Yet, I believe that there will be unintended consequences of the trade disputes with China, and this will simply be a matter of time. Once mutual tariffs have been activated, their impact will be felt as earnings of multi-national corporations are bound to be negatively affected, may be even as soon as the next quarter. Right now, verbal volleys are flying back and forth, and the tug-of-war goes on.

However, worldwide, markets ignored any trade differences, and the bulls had it their way, which ZH summed up as follows:

Perhaps due to a lack of further trade war escalation, it is a sea of green in risk assets as overnight global stocks pushed toward a six-month high following the biggest jump in Chinese stocks in over two years and an upbeat start for Europe followed Wall Street’s best close since January, with the S&P now just 22 points away from breaching its all-time high of 2,873 reached on January 26.

Given the recent run, its seems that the computer algos are programmed to take out that old S&P 500 high, which could happen as early as this week. In the meantime, let’s enjoy this relative calm in the market. The VIX, while currently hovering at a subdued level, can turn the tide at any time.

Read More

Tech Leads As Bull Run Continues

Ulli Market Commentary Contact

[Chart courtesy of MarketWatch.com]
  1. Moving the markets

After a brief opening dip, the major indexes continued their ramp higher with the Nasdaq notching its 5th straight day of gains, as decent corporate earnings remained in focus. While our portfolio holdings have all gained in sync for the past 3 sessions, tech (QQQ) and consumer discretionaries (XLY), our latest additions, took top billing with +0.59% and +0.67% respectively.

The gains were not necessarily spectacular, but they have been solid and steady, which is preferable to fast and furious given the lofty levels of the indexes. For sure, the market’s more cautious advances were in part caused by the ever-lingering trade talks and the impact they will have long-term on the profitability of multi-national corporations.

Make no mistake, any upcoming retaliatory tariffs from trading partners will affect stock markets, especially once rhetoric is replaced by action. We saw that today, when weakness showed up in Germany, the European export powerhouse, where manufacturing orders plunged 4% in June, a clear sign that global trade disputes are leaving their mark.

While I appreciate any rally that comes our way, we also must be aware that most of the support comes from a few glamor stocks. In other words, the breadth is lacking, as you can see in this chart showing that the number of new highs is declining despite market advances.

Add to that the fact that economic data points have been shaky at best and disappointing at worst (real estate), which makes it even more amazing that the Nasdaq manages to ignore, so far, some of these realities as this chart shows. Which leaves me pondering “how long can that go on?

Read More

ETFs On The Cutline – Updated Through 08/03/2018

Ulli ETFs on the Cutline Contact

Below, please find the latest High Volume ETFs Cutline report, which shows how far above or below their respective long-term trend lines (39 week SMA) my currently tracked ETFs are positioned.

This report covers the HV ETF Master List from Thursday’s StatSheet and includes 366 High Volume ETFs ETFs, defined as those with an average daily volume of more than $5 million, of which currently 175 (last week 175) are hovering in bullish territory. The yellow line separates those ETFs that are positioned above their trend line (%M/A) from those that have dropped below it.

Take a look:

The HV ETF Master Cutline Report

In case you are not familiar with some of the terminology used in the reports, please read the Glossary of Terms.

If you missed the original post about the Cutline approach, you can read it here.