
- Moving the markets
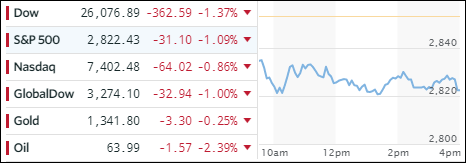
It should be no surprise to anyone that, given the tear the markets have been on over the past 14 months without much of an interruption, a correction or pullback was way overdue. Weakness was broad based with the main culprits being healthcare, technology, energy and financials. Especially, some of the diving healthcare stocks contributed some 40% of the Dow’s decline.
Not helping matters was another VIX spike to above the 15 handle, its highest level since August. Bond yields continued pushing up with the 30-year now honing in on the psychologically important 3% level, while the 10-year yield sported a gain of 3 basis points to end the session at 2.73%. Both, bond and stock holders, had the worst day since election when considering that the much hyped “safe” combination, stocks down and bonds up, failed.
However, in the end, a view of the big picture is important, which says equities are still on path to their best monthly gain in 2 years—and the 15th monthly gain in a row (thanks to ZH for this stat). The US dollar (UUP) took a dive despite Treasury Secretary Mnuchin desperately trying to take back his words at Davos that “a weaker dollar is good for us as it relates to trade and opportunities.” His jawboning today, that he “supports a strong greenback in the long term,” merely softened the dollar’s slide.
- ETFs in the Spotlight
In case you missed the announcement and description of this section, you can read it here again.
It features 10 broadly diversified and sector ETFs from my HighVolume list as posted every Saturday. Furthermore, they are screened for the lowest MaxDD% number meaning they have been showing better resistance to temporary sell offs than all others over the past year.
The below table simply demonstrates the magnitude with which some of the ETFs are fluctuating in regards to their positions above or below their respective individual trend lines (%M/A). A break below, represented by a negative number, shows weakness, while a break above, represented by a positive percentage, shows strength.
For hundreds of ETF choices, be sure to reference Thursday’s StatSheet.
Year to date, here’s how our candidates have fared so far:
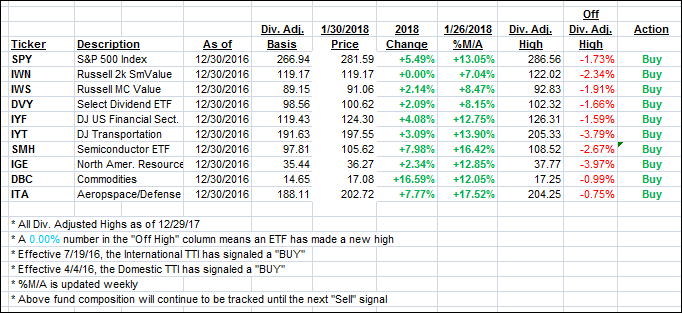
Again, the %M/A column above shows the position of the various ETFs in relation to their respective long term trend lines, while the trailing sell stops are being tracked in the “Off High” column. The “Action” column will signal a “Sell” once the -7.5% point has been taken out in the “Off High” column.
- Trend Tracking Indexes (TTIs)
Our Trend Tracking Indexes (TTIs) headed south as the bears remained in charge for the second day in a row.
Here’s how we closed 1/30/2018:
Domestic TTI: +4.71% above its M/A (last close +5.09%)—Buy signal effective 4/4/2016
International TTI: +8.30% above its M/A (last close +9.09%)—Buy signal effective 7/19/2016
Disclosure: I am obliged to inform you that I, as well as my advisory clients, own some of the ETFs listed in the above table. Furthermore, they do not represent a specific investment recommendation for you, they merely show which ETFs from the universe I track are falling within the guidelines specified.
Contact Ulli