
- Moving the markets
At least for today, earnings were enough of a positive to beat anxiety over trade war fears with the major indexes continuing their bullish run, reinforced by the S&P companies showing earnings growth of 24% and sales gains of 9.8%.
As MarketWatch put it: “Strong earnings have helped bolster the belief that steady US economic growth will continue to support corporate bottom lines and keep stocks buoyant.”
Yet, I believe that there will be unintended consequences of the trade disputes with China, and this will simply be a matter of time. Once mutual tariffs have been activated, their impact will be felt as earnings of multi-national corporations are bound to be negatively affected, may be even as soon as the next quarter. Right now, verbal volleys are flying back and forth, and the tug-of-war goes on.
However, worldwide, markets ignored any trade differences, and the bulls had it their way, which ZH summed up as follows:
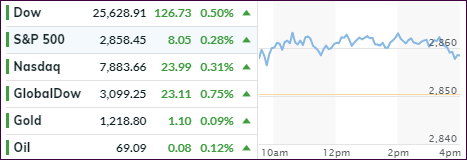
Perhaps due to a lack of further trade war escalation, it is a sea of green in risk assets as overnight global stocks pushed toward a six-month high following the biggest jump in Chinese stocks in over two years and an upbeat start for Europe followed Wall Street’s best close since January, with the S&P now just 22 points away from breaching its all-time high of 2,873 reached on January 26.
Given the recent run, its seems that the computer algos are programmed to take out that old S&P 500 high, which could happen as early as this week. In the meantime, let’s enjoy this relative calm in the market. The VIX, while currently hovering at a subdued level, can turn the tide at any time.
- ETFs in the Spotlight
In case you missed the announcement and description of this section, you can read it here again.
It features 10 broadly diversified and sector ETFs from my HighVolume list as posted every Saturday. Furthermore, they are screened for the lowest MaxDD% number meaning they have been showing better resistance to temporary sell offs than all others over the past year.
The below table simply demonstrates the magnitude with which some of the ETFs are fluctuating regarding their positions above or below their respective individual trend lines (%M/A). A break below, represented by a negative number, shows weakness, while a break above, represented by a positive percentage, shows strength.
For hundreds of ETF choices, be sure to reference Thursday’s StatSheet.
Year to date, here’s how our candidates have fared so far:
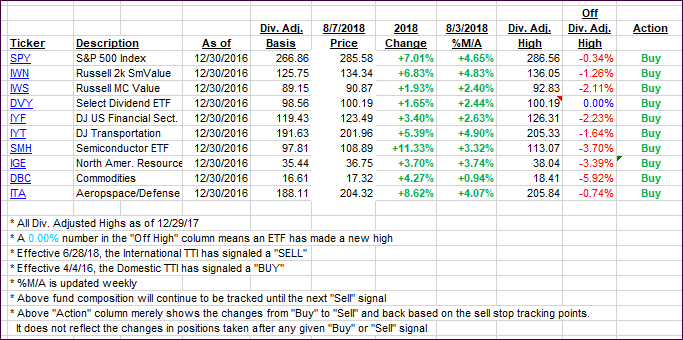
Again, the %M/A column above shows the position of the various ETFs in relation to their respective long-term trend lines, while the trailing sell stops are being tracked in the “Off High” column. The “Action” column will signal a “Sell” once the -8% point has been taken out in the “Off High” column. For more volatile sector ETFs, the trigger point is -10%.
- Trend Tracking Indexes (TTIs)
Our Trend Tracking Indexes (TTIs) moved higher as the bulls continued their run.
Here’s how we closed 08/07/2018:
Domestic TTI: +2.96% above its M/A (last close +2.75%)—Buy signal effective 4/4/2016
International TTI: +0.99% above its M/A (last close +0.47%)—Buy signal effective 7/26/2018
Disclosure: I am obliged to inform you that I, as well as my advisory clients, own some of the ETFs listed in the above table. Furthermore, they do not represent a specific investment recommendation for you, they merely show which ETFs from the universe I track are falling within the guidelines specified.
Contact Ulli