
- Moving the markets
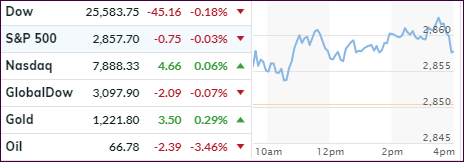
It was more-or-less a consolidation day with 2 of the 3 major indexes scoring fractional losses, while the Nasdaq managed to buck the trend to nowhere by closing in the green and thereby attaining its longest win streak (7 days) in about 5 months.
However, more trade disputes between the US and China, along with a bunch of weak earnings results (Disney, Snap) weakened markets, but the impact was not strong enough to disrupt the positive effect of the overall earnings season, which has been the primary driver supporting the bullish case.
Interest rates lived in a world of their own and did something that I have never seen before—namely nothing. A look at this table left me simply amazed at the odds of all bond yields being left unchanged at the end of the day.
Maybe it’s a precursor of markets transitioning into their slowest summer trading period, where fewer traders can easily push the indexes around, which is why I expect the Nasdaq and S&P 500 to break out to new highs. In the case of the S&P, that would be a move of about +0.5%.
- ETFs in the Spotlight
In case you missed the announcement and description of this section, you can read it here again.
It features 10 broadly diversified and sector ETFs from my HighVolume list as posted every Saturday. Furthermore, they are screened for the lowest MaxDD% number meaning they have been showing better resistance to temporary sell offs than all others over the past year.
The below table simply demonstrates the magnitude with which some of the ETFs are fluctuating regarding their positions above or below their respective individual trend lines (%M/A). A break below, represented by a negative number, shows weakness, while a break above, represented by a positive percentage, shows strength.
For hundreds of ETF choices, be sure to reference Thursday’s StatSheet.
Year to date, here’s how our candidates have fared so far:
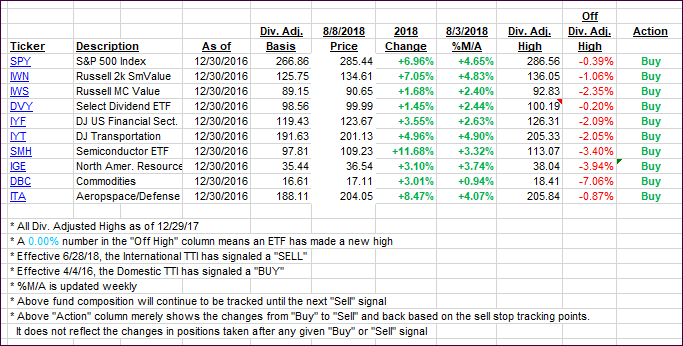
Again, the %M/A column above shows the position of the various ETFs in relation to their respective long-term trend lines, while the trailing sell stops are being tracked in the “Off High” column. The “Action” column will signal a “Sell” once the -8% point has been taken out in the “Off High” column. For more volatile sector ETFs, the trigger point is -10%.
- Trend Tracking Indexes (TTIs)
Our Trend Tracking Indexes (TTIs) diverged with the Domestic one sliding a tad, while the International one headed north.
Here’s how we closed 08/08/2018:
Domestic TTI: +2.93% above its M/A (last close +2.96%)—Buy signal effective 4/4/2016
International TTI: +1.11% above its M/A (last close +0.99%)—Buy signal effective 7/26/2018
Disclosure: I am obliged to inform you that I, as well as my advisory clients, own some of the ETFs listed in the above table. Furthermore, they do not represent a specific investment recommendation for you, they merely show which ETFs from the universe I track are falling within the guidelines specified.
Contact Ulli