ETF Tracker StatSheet
https://theetfbully.com/2018/05/weekly-statsheet-for-the-etf-tracker-newsletter-updated-through-05-31-2018/
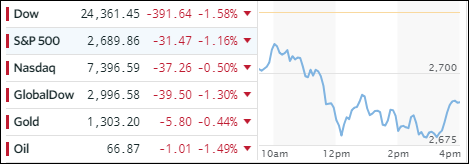
STILL STUCK IN ‘NO MAN’S LAND’
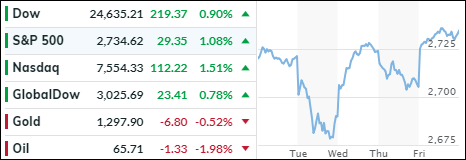
[Chart courtesy of MarketWatch.com]
- Moving the markets
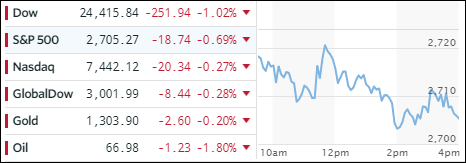
The above weekly chart demonstrates the 4-day roller coaster ride we just went through. While this clearly points to the ever present uncertainties, as perceived by the markets, the S&P 500 and the Nasdaq managed to close a tad higher, but the Dow lagged and closed lower at week’s end.
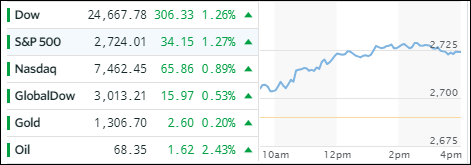
Throwing the big assist, after yesterday’s plunge, was a stronger-than-expected jobs report showing 223k new jobs created vs. 200k expected, while the unemployment rate fell to 3.8%, an 18-year low. Impressive was that gains were more broad based, and not just minimum wage, but also covering sectors such as Professional Services, Manufacturing, Education and Healthcare.
On the other hand, the numbers seem confusing and do not add up, as there are some 102 million Americans who are either unemployed or out of the labor force. Be that as it may, the markets did not care and the headline number simply ruled, giving the major indexes a chance to dig themselves out of yesterday’s hole.
While trade wars and concerns about Italian politics are still alive, some alleged progress was made last night, as the populist parties struck a deal to form a coalition government ending months of gridlock. That propelled the European markets and spilled over into the U.S. right after the opening bell.
The fact that markets tend to ignore realities, and prefer focusing on the headline du jour, is best illustrated by ZH’s summary:
- New anti-establishment Italian government? Check.
- New anti-establishment, socialist Spanish government? Check.
- Trade war between the US and Europe, Mexico, & Canada? Check.
- Deutsche Bank (most systemically risky bank in the world at one point) downgraded to a B-handle? Check.
- Fed Tightening as rate-hike odds rise after good jobs data trumps EU risk? Check.
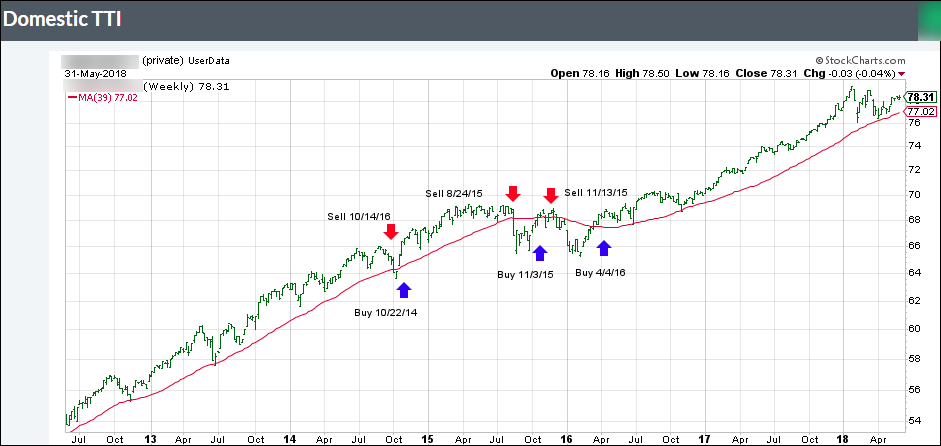
In the end, while weakened during the roller-coaster ride, our Trend Tracking Indexes (TTIs) remain in bullish territory. Even the International one, which had come to within 0.02% of crossing into bear market territory, bounced off its trend line showing signs of a modest recovery.
I expect this type of wild ride to continue until some massive event appears that will push the markets out of its current trading range. The only question remains “will it be to the upside or to the downside?” We have to be prepared for either one.
In a way, Morgan Stanley is already prepping its clients for the next stock market crash using sophisticated technology and advising them to Hold On For Dear Life (HODL) at a time when bullishness is the prevailing theme not only on Wall Street but around most parts of the world as well.
Read More

