See-Sawing Higher

Ulli Market Commentary Contact

[Chart courtesy of MarketWatch.com]
  1. Moving the markets

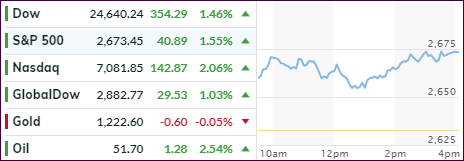
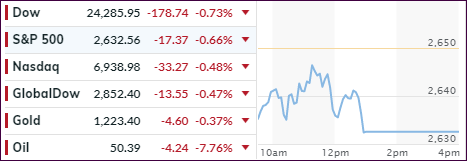
For most of the session, the major indexes see-sawed in and out of the red before, late in the day, cautious optimism prevailed insuring a green close. The gains were small, especially for the Nasdaq which barely crawled above the unchanged line. Despite the positive tone, SmallCaps (IWN) were not so lucky and got spanked at the tune of -0.60%.

Keeping market direction in check were remarks from President Trump regarding Chinese tariffs, when he refused to rule any increases in the future. Trump and Xi will meet this weekend in Buenos Aires at the G-20 summit. If there are any positive news coming out of this meeting, I believe the markets will take off and likely start the much-anticipated year-end rally. If no agreement is reached, we may see the aimless meandering continue.

After yesterday’s pop, GM’s stock price slid almost 3%, when Trump announced that he is looking at withdrawing subsidies as a result of the car maker’s decision to close plants and layoff almost 15k employees in the US and Canada.

EU and Italy tensions were back on, as Italy reneged on yesterday’s softening tone regarding their budget deficit pulling the European markets down into the red after an opening pop.

The US dollar rallied again and is now within striking distance of its 2018 highs, while gold retreated and oil is desperately hanging on to the $50 handle. Despite Trump’s economic advisor Kudlow spouting off that “our economy is in good shape, China’s is not,” global markets don’t see it that way, as the direction across the board remains “down” and not “up.”
Read More

Bouncing Back From Last Week’s Disaster

Ulli Market Commentary Contact

[Chart courtesy of MarketWatch.com]
  1. Moving the markets

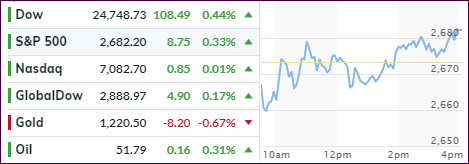
After last week’s drubbing, it came as no surprise that a rebound was in order. Closely watched was the retail sector with analysts trying to gain some perspective as to the shopping traffic leading into the Holiday season. The picture was mixed, and not conclusive, as in-story traffic fell as much as 9% compared to last year’s Black Friday. However, internet sales made up for it by rising 26.4% year over year.

That was good enough to get a rally going, which was further supported by an easing of the stand-off between Italy and the EU regarding the budget deficit. That helped European markets to surge with the effects spilling over into the US.

Today looked like an oversold bounce, along with the biggest short-squeeze in some 4 weeks, giving the bulls finally as say in the outcome of this session. On the other hand, GM’s news of closing several plants and laying off over 14,000 people should have dampened the animal spirits but did not as GM’s stock was halted but soared 7%. Go figure… At the same time, the other American icon, GE, tumbled to cycle lows, but managed to cut intra-day losses.

On deck is the G-20 summit meeting this coming weekend where for sure Trump and his Chinese counterpart Xi will meet and create a flurry of headline news about the hottest topic, namely trade tensions. Any outcome, that can be confirmed as positive is sure to ignite the markets and may create the much talked about year-end rally.

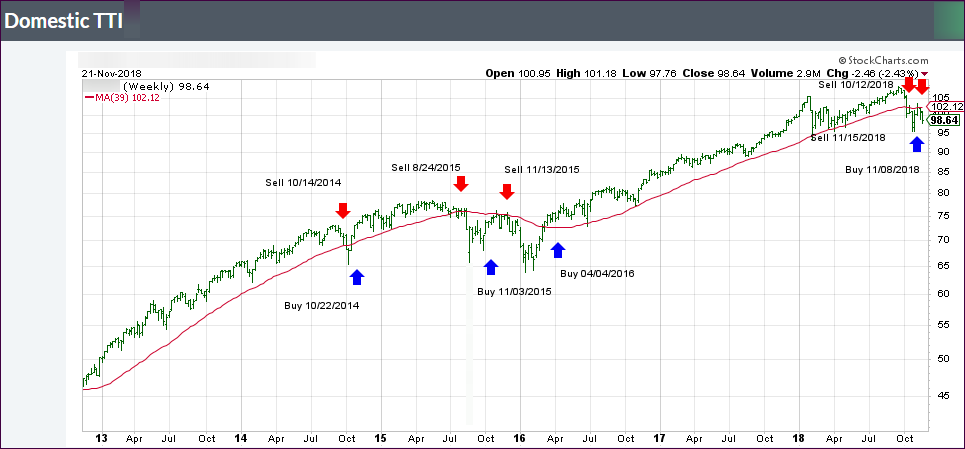
Our Trend Tracking Indexes (TTIs) improved but remain on the bearish side of their respective trend lines for the time being. I am sure, the roller coaster ride is bound to continue, but should the path shift in favor of the bulls, we will jump back in at that time.

Read More

ETFs On The Cutline – Updated Through 11/23/2018

Ulli ETFs on the Cutline Contact

Below, please find the latest High-Volume ETF Cutline report, which shows how far above or below their respective long-term trend lines (39-week SMA) my currently tracked ETFs are positioned.

This report covers the HV ETF Master List from Thursday’s StatSheet and includes 322 High Volume ETFs, defined as those with an average daily volume of more than $5 million, of which currently 42 (last week 56) are hovering in bullish territory. The yellow line separates those ETFs that are positioned above their trend line (%M/A) from those that have dropped below it.

Take a look:

The HV ETF Master Cutline Report

In case you are not familiar with some of the terminology used in the reports, please read the Glossary of Terms.

If you missed the original post about the Cutline approach, you can read it here.

ETF Tracker Newsletter For November 23, 2018

Ulli ETF Tracker Contact

ETF Tracker StatSheet

https://theetfbully.com/2018/11/weekly-statsheet-for-the-etf-tracker-newsletter-updated-through-11-21-2018/

THE WORST THANKSGIVING WEEK IN 7 YEARS

[Chart courtesy of MarketWatch.com]
  1. Moving the markets

Despite an early rally attempt based on hope that “black Friday” would do wonders for the retail sector, the gains could not be sustained, and the major indexes plunged into the close during this Holiday shortened session.

In the end, things continued to look bleak for the bulls with the indexes scoring their worst Thanksgiving week since 2011. How bad was it? The Nasdaq tumbled -4.3%, the Dow slipped -4.4% and the S&P 500 turned out to be the “winner” by “only” losing -3.8%. That is down 10% from its record closing high and confirms that is now in correction territory.

Crude oil (WTI) took top billing again by crashing almost -8% to a 10-year low and is barely hanging on to a $50 handle. Sure, much of the headlines talk about supply worries ahead of an upcoming OPEC meeting, but to me the real reason is simply a slowdown in global growth activity. That is why our International Trend Tracking Index (TTI) has been in bear market territory since 10/11/2018. Bear markets are a result of economic slowdowns.

This chart, hat tip goes to ZH, demonstrates that “soft” survey data is starting to catch down to the “hard” reality of economic data. If this continues, we’ll sure be welcoming the S&P 500 to bear market territory soon (another 10% drop).

It’s good to be on the sidelines.

Read More

Weekly StatSheet For The ETF Tracker Newsletter – Updated Through 11/21/2018

Ulli ETF StatSheet Contact

ETF Data updated through Wednesday, November 21, 2018

Methodology/Use of this StatSheet:

  1. From the universe of over 1,800 ETFs, I have selected only those with a trading volume of over $5 million per day (HV ETFs), so that liquidity and a small bid/ask spread are assured.
  2. Trend Tracking Indexes (TTIs)

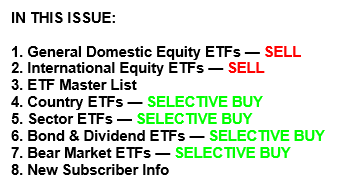
Buy or Sell decisions for Domestic and International ETFs (section 1 and 2), are made based on the respective TTI and its position either above or below its long-term M/A (Moving Average). A crossing of the trend line from below accompanied by some staying power above constitutes a “Buy” signal. Conversely, a clear break below the line constitutes a “Sell” signal. Additionally, I use a 7.5% trailing stop loss on all positions in these categories to control downside risk.

  1. All other investment arenas do not have a TTI and should be traded based on the position of the individual ETF relative to its own respective trend line (%M/A). That’s why those signals are referred to as a “Selective Buy.” In other words, if an ETF crosses its own trendline to the upside, a “Buy” signal is generated. Since these areas tend to be more volatile, I recommend a wider trailing sell stop of 7.5% -10% depending on your risk tolerance.

If you are unfamiliar with some of the terminology, please see Glossary of Terms and new subscriber information in section 9.


  1. DOMESTIC EQUITY ETFs: SELL — since 11/15/2018

Click on chart to enlarge

Our main directional indicator, the Domestic Trend Tracking Index (TTI-green line in the above chart) is now positioned below its long-term trend line (red) by -3.46% after having generated a new Domestic “Sell” signal effective 11/15/18 as posted.

Read More

A Hopeful Bounce Bites The Dust

Ulli Market Commentary Contact

[Chart courtesy of MarketWatch.com]
  1. Moving the markets

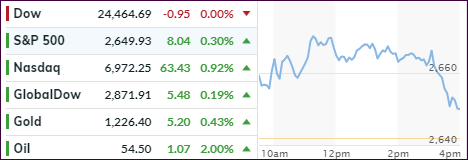
With the Dow having lost about 950 points over the past 2 days, it was time for the major indexes to bounce back, at least for one session, in order to recapture some of the ugly losses. That attempt turned into a head fake as, late in the day, momentum reversed with the Dow giving back all its early gains.

But, the S&P 500 managed to recoup +0.30%, while the beaten down Nasdaq fared the best by adding +0.92%. Obviously, pre-Thanksgiving volume was low, so we should not put too much value into today’s action. Historically, however, this week went down as the worst start to Thanksgiving week in 45 years.

Yesterday’s decline erased YTD gains for the Dow and S&P 500, but the Nasdaq is hanging on to a 1.1% advance. For the month of November, things look bleak with the 3 major indexes being down led by the Nasdaq with -3.9%. Ouch.

As I have repeatedly said, equity risk has increased and the bear market, as I define it with my Trend Tracking Indexes (TTIs), is upon us, which makes this the perfect time to be out of the markets and on the sidelines.

Happy Thanksgiving!

Read More