
- Moving the markets
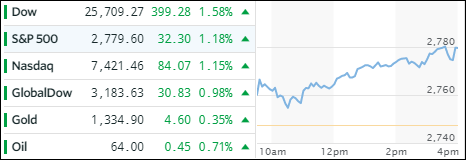
After several failed rally attempts early last week, the bulls regained the upper hand with the major indexes advancing for the third day in a row. Fears, that the Fed might be on a rate hike binge, were alleviated when 2 of the Fed’s mouth pieces took front and center and calmed down nervous traders.
First, Fed President Bullard opined that “the so-called neutral US interest rate may not rise much over the next two years.” Then Fed Governor Quarles soothed raw nerves even further by saying that he sees ‘encouraging signs’ of a turning point in the economy’s long-run growth prospects and that “faster growth will not automatically lead to out-of-control inflation.” That’s all it took, and the markets shifted into overdrive.
The technology sector led the rally with Semiconductors (SMH) taking top billing with a solid +2.12% gain, followed by Transportations (IYT +1.80%), Financials (XLF +1.51%) and Large Caps (SCHX +1.11%). All of our current holdings closed in the green.
Lower interest rates assisted the rally with the 10-year bond yield retreating 2 basis points to 2.86%. After its recent zigzag, the US Dollar (UUP) slipped -0.13%, which had no effect on market behavior.
- ETFs in the Spotlight
In case you missed the announcement and description of this section, you can read it here again.
It features 10 broadly diversified and sector ETFs from my HighVolume list as posted every Saturday. Furthermore, they are screened for the lowest MaxDD% number meaning they have been showing better resistance to temporary sell offs than all others over the past year.
The below table simply demonstrates the magnitude with which some of the ETFs are fluctuating in regards to their positions above or below their respective individual trend lines (%M/A). A break below, represented by a negative number, shows weakness, while a break above, represented by a positive percentage, shows strength.
For hundreds of ETF choices, be sure to reference Thursday’s StatSheet.
Year to date, here’s how our candidates have fared so far:
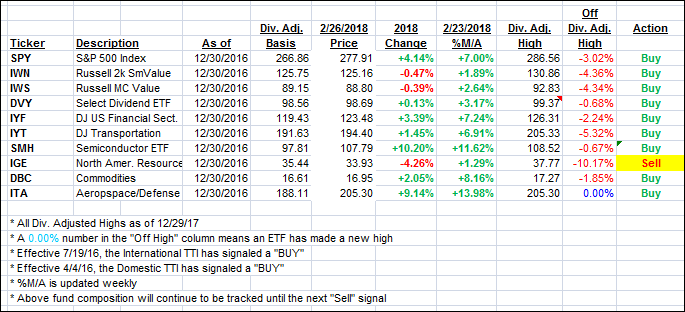
Again, the %M/A column above shows the position of the various ETFs in relation to their respective long term trend lines, while the trailing sell stops are being tracked in the “Off High” column. The “Action” column will signal a “Sell” once the -7.5% point has been taken out in the “Off High” column.
- Trend Tracking Indexes (TTIs)
Our Trend Tracking Indexes (TTIs) headed north as the bulls were clearly in charge.
Here’s how we closed 2/26/2018:
Domestic TTI: +3.79% above its M/A (last close +3.34%)—Buy signal effective 4/4/2016
International TTI: +4.72% above its M/A (last close +4.19%)—Buy signal effective 7/19/2016
Disclosure: I am obliged to inform you that I, as well as my advisory clients, own some of the ETFs listed in the above table. Furthermore, they do not represent a specific investment recommendation for you, they merely show which ETFs from the universe I track are falling within the guidelines specified.
Contact Ulli