
- Moving the markets
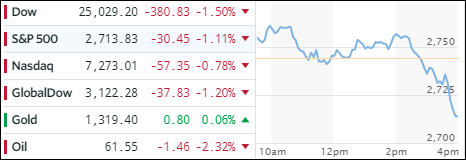
Today, it was economic data points that caused increased market volatility and sent the major indexes into a tailspin closing at the lows of the day. We started the session on a positive note, then bounced around the unchanged line for a while and finally accelerated to the downside with the S&P and Dow registering its worst month in two years.
Today, as well as for most of the month, there was no place to hide, with MarketWatch summing it up best:
Equities have struggled throughout February, with the Dow and the S&P 500 dropping into correction territory earlier this month, defined as a 10% drop from a recent high. The monthly losses were broad, with all 11 primary S&P 500 industry groups closing in negative territory.
With comments from new Fed chief Powell having sparked yesterday’s sell-off, today the culprit appeared to be poor economic data. First, GDP growth was reduced to 2.5% from 2.6% in the fourth quarter. This was followed by the Chicago PMI, which slipped to a six-month low in February, and Pending home sales, which plunged the most since 2010 (-4.7% in January vs. an expected +0.5%).
Surprisingly, bad news like these, are suddenly perceived as actually being bad news, while similar poor economic readings were simply overlooked during the past year as the bull market raged on. Maybe we have now reached a point where a sense of reality not only has set in but needs to be dealt with.
In terms of overall market direction, we are still bullish but have to be aware that this situation could change and that the bounce-back of the past 3 weeks really has legs and is not a just continuation of the short-term downtrend started early in February. After all, in the early phase potential bear markets start slowly and demonstrate violent rebound abilities.
- ETFs in the Spotlight
In case you missed the announcement and description of this section, you can read it here again.
It features 10 broadly diversified and sector ETFs from my HighVolume list as posted every Saturday. Furthermore, they are screened for the lowest MaxDD% number meaning they have been showing better resistance to temporary sell offs than all others over the past year.
The below table simply demonstrates the magnitude with which some of the ETFs are fluctuating in regards to their positions above or below their respective individual trend lines (%M/A). A break below, represented by a negative number, shows weakness, while a break above, represented by a positive percentage, shows strength.
For hundreds of ETF choices, be sure to reference Thursday’s StatSheet.
Year to date, here’s how our candidates have fared so far:
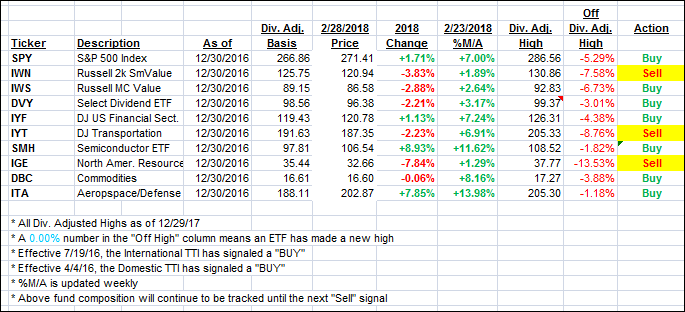
Again, the %M/A column above shows the position of the various ETFs in relation to their respective long term trend lines, while the trailing sell stops are being tracked in the “Off High” column. The “Action” column will signal a “Sell” once the -7.5% point has been taken out in the “Off High” column.
- Trend Tracking Indexes (TTIs)
Our Trend Tracking Indexes (TTIs) headed south with poor economic data pulling the rug out from under the bullish crowd.
Here’s how we closed 2/28/2018:
Domestic TTI: +2.79% above its M/A (last close +3.21%)—Buy signal effective 4/4/2016
International TTI: +2.74% above its M/A (last close +3.67%)—Buy signal effective 7/19/2016
Disclosure: I am obliged to inform you that I, as well as my advisory clients, own some of the ETFs listed in the above table. Furthermore, they do not represent a specific investment recommendation for you, they merely show which ETFs from the universe I track are falling within the guidelines specified.
Contact Ulli