Investors On Edge As Inflation Report Looms; Bitcoin Steals The Show

Ulli Market Commentary Contact

[Chart courtesy of MarketWatch.com]

  1. Moving the markets

Investors were cautious today as they awaited a crucial inflation report coming out later this week. The report, based on the PCE index for January, is the Fed’s favorite way to measure inflation. Until then, the market is in limbo, waiting for a signal.

The market is also trying to extend its recent gains that pushed the Dow and the S&P 500 to record highs. But this week, the market has stumbled, falling slightly. The major indexes are heading for their second losing week in three.

The downturn, especially for the tech sector, has made me wonder if the rally driven by AI enthusiasm can last. I doubt it, because most of the stock gains from AI are based on hype and marketing. Only a few companies have actually seen a real boost in revenue from AI.

The real action today was in crypto space, where I have been an investor since 2017. Now that Bitcoin ETFs are available, I am also using this unique asset class in my advisory practice.

Bitcoin soared a whopping 13% to almost $64,000 before a wave of selling pressure (likely from futures) caused Coinbase mayhem, erasing $5,000 of the gains before bouncing back up again. By the end of the US equity trading session, bitcoin was at $60,000, still up 6% and close to breaking its all-time high.

Today, apart from crypto, stocks were lower led by Small Caps and Nasdaq. Most of the selling pressure came at the European open (and we recovered into the European close), but those recovery gains didn’t last. The Dow ended the day as the bestof the worst.

Bond yields fell across the board, the dollar rebounded from its recent slide, gold dropped and rose to close in the green, and oil prices gave up yesterday’s gains.

Economically, as ZeroHedge noted, the consumer is still struggling, as the Credit Manager’s survey shows that the rate of “rejections” for credit applications and the number of accounts moved to “collections”, is spiking to 2008 levels.

Yikes!

Read More

Last Hour Bounce Saves S&P 500 And Nasdaq From Red Close

Ulli Market Commentary Contact

[Chart courtesy of MarketWatch.com]

  1. Moving the markets

It was a dull day for the stock market, as the major indexes barely moved, and the rally took a nap. Investors were waiting for some important data coming out later this week, but they got a surprise in the last hour when the S&P 500 and the Nasdaq turned green, thanks to another short squeeze.

The market had no clear direction, as different sectors did their own thing. This followed a down day on Monday that erased the record highs that the Dow and the S&P 500 reached last week, after Nvidia impressed everyone with its earnings.

The U.S. Department of Commerce reported on Tuesday that orders for durable goods, such as cars and appliances, fell more than expected in January, mainly because people didn’t want to buy transportation.

The latest consumer confidence numbers also dropped, as people worried about the job market and the political situation. The Consumer Confidence Index fell to 106.7, which was lower than the revised 110.9 in January and below the forecast of 115.1. These numbers come before the PCE index, which measures inflation, and the personal income and spending data, which will be released on Thursday.

Traders will keep an eye on these figures to see how the economy is doing and what the Fed might do next.

Oil prices soared to their highest level since November, the dollar kept falling, gold stayed steady, and bond yields were mixed. Durable goods orders had their worst month since the Covid lockdowns, while US Home prices kept rising for the 11th month in a row in December.

The economy was sending mixed signals, so we’ll have to wait and see if the upcoming data can clear things up.

Or will we be left in the dark?

Read More

Amazon Joins Dow, S&P 500 Retreats, AI Boom In Question

Ulli Market Commentary Contact

[Chart courtesy of MarketWatch.com]

  1. Moving the markets

The S&P 500 took a small step back from its record high on Friday, as investors waited for the latest inflation data. Amazon replaced Walgreens in the Dow, boosting the index’s tech and retail exposure. The Dow is based on stock prices, not market values, so Amazon’s hefty share price will have a big impact.

Treasury yields rose on Monday, hurting the stock market. The 10-year yield reached 4.279%, up slightly from Friday. Investors are wondering if the AI boom can continue amid economic and inflation uncertainties.

They are also looking forward to the Fed’s favorite inflation measure, the PCE index, which will be released on Thursday. Wall Street is feeling more optimistic about stocks after a strong earnings season. But the Fed is still watching inflation closely and may not cut interest rates anytime soon. The market is lowering its hopes for a rate cut this year.

There are more economic reports coming up, such as durable goods orders, wholesale inventories, consumer spending, and PCE numbers. They will give more clues about the state of the economy and inflation.

The bond market was not happy with the 2-year and 5-year auctions, which pushed yields higher across the board. This reversed some of the gains from Friday.

The MAG7 stocks, which include Microsoft, Apple, Google, Amazon, Facebook, Netflix, and Tesla, were weak after Nvidia dropped from its peak. But the most shorted stocks rallied, thanks to some aggressive buying. They helped the small-cap stocks, but not enough to lift the major indexes into positive territory.

The dollar and gold were both flat for the second day in a row, while crude oil bounced back from Friday’s losses.

Cisco and Nvidia are still following their historical patterns.

Will they keep doing so?

Read More

ETFs On The Cutline – Updated Through 02/23/2024

Ulli ETFs on the Cutline Contact

Do you want to know which ETFs are hot and which ones are not? Then you need my High-Volume ETF Cutline report. It tells you how close or far each of the 311 ETFs I follow is from its long-term trend line (39-week SMA). These are the ETFs that trade more than $5 million a day, so they are not some obscure funds that nobody cares about.

The report is split into two parts: The winners that are above their trend line (%M/A), and the losers that are below it. The yellow line is the line of shame that separates them. You can see how many ETFs are in each group and how they have changed since the last report (258 vs. 261 current).

Take a peek:

The HV ETF Master Cutline Report

If you are confused by some of the terms we use, don’t panic. I have a helpful Glossary of Terms for you.

If you want to learn more about the Cutline method and how it can make you rich (or at least less poor), read my original post here.

ETF Tracker Newsletter For February 23, 2024

Ulli ETF Tracker Contact

ETF Tracker StatSheet          

You can view the latest version here.

NVIDIA LEADS THE TECH RALLY, BUT WILL IT FOLLOW CISCO’S DOWNFALL?

[Chart courtesy of MarketWatch.com]

  1. Moving the markets

Stocks ended the week with a bang, thanks to Nvidia’s stellar earnings, that pushed its market value above $2 trillion. The chipmaker is now the third most valuable U.S. company, trailing only Microsoft and Apple.

Not bad for a company that started out making graphics cards for video games. Nvidia’s success lifted the whole market, but not everyone was happy.

Some investors decided to cash in on the tech frenzy and sell some shares at record highs. The MAG7 stocks, the group of seven most influential tech companies, also felt the pressure and retreated from their peaks.

The S&P 500 had its best day in over a year, while the Nasdaq Composite soared 3% for its best performance in 11 months. The Dow also gained 1.2%, but the Small Caps were left behind and lost 1% for the week. It seems that size does matter, at least in the stock market.

While technology was the star of the show, the best performing sector was surprisingly Consumer Staples. Maybe people were stocking up on toilet paper and canned food, just in case. Energy was the worst performer, as oil prices failed to break above January’s highs and slid lower for the week.

Bond yields eased from yesterday’s highs, as the market lowered its expectations for rate cuts in 2024. The odds of four cuts are now just 30%, with June being the most likely month for the first one.

But stocks don’t seem to care about reality, they just keep going up and up. Gold had a strong week, rising 6 of the last 7 days and closing at the highest level since the beginning of the month. The dollar weakened during the week but bounced back from a sharp drop on Wednesday night.

The big question is whether Nvidia can keep up this pace and avoid the fate of Cisco, which crashed after reaching a similar valuation in 2000. This chart shows that we are getting closer to a critical point.

Are we witnessing history repeating itself, or is this time different?

Read More

Weekly StatSheet For The ETF Tracker Newsletter – Updated Through 02/22/2024

Ulli ETF StatSheet Contact

ETF Data updated through Thursday, February 22, 2024

How to use this StatSheet:

  1. Out of the 1,800+ ETFs out there, I only pick the ones that trade over $5 million per day (HV ETFs), so you don’t get stuck with a lemon that nobody wants to buy or sell.
  1. Trend Tracking Indexes (TTIs)

These are the main indicators that tell you when to buy or sell Domestic and International ETFs (section 1 and 2). They do that by comparing their position to their long-term M/A (Moving Average). If they cross above, and stay there, it’s a green light to buy. If they fall below, and keep going, it’s a red light to sell. And to make sure you don’t lose your shirt if things go south, I also use a 12% trailing stop loss on all positions in these categories.

  1. All other investment areas don’t have a TTI and should be traded based on the position of each ETF relative to its own trend line (%M/A). That’s why I call them “Selective Buy.” In other words, if an ETF goes above its own trend line, you can buy it. But don’t forget to use a trailing sell stop of 12%, or less if you’re feeling nervous.

If some of these words sound like Greek to you, please check out the Glossary of Terms and new subscriber information in section 9.

  1. DOMESTIC EQUITY ETFs: BUY— since 11/21/2023

Click on chart to enlarge

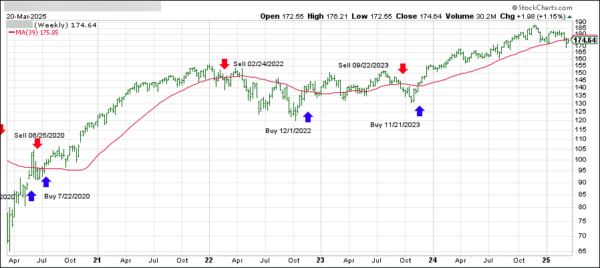
This is our main compass, the Domestic Trend Tracking Index (TTI-green line in the above chart). It has broken above its long-term trend line (red) by +9.03% and is in “Buy” mode as posted.

Read More