
- Moving the markets
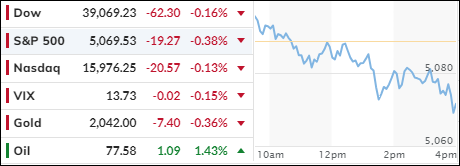
The S&P 500 took a small step back from its record high on Friday, as investors waited for the latest inflation data. Amazon replaced Walgreens in the Dow, boosting the index’s tech and retail exposure. The Dow is based on stock prices, not market values, so Amazon’s hefty share price will have a big impact.
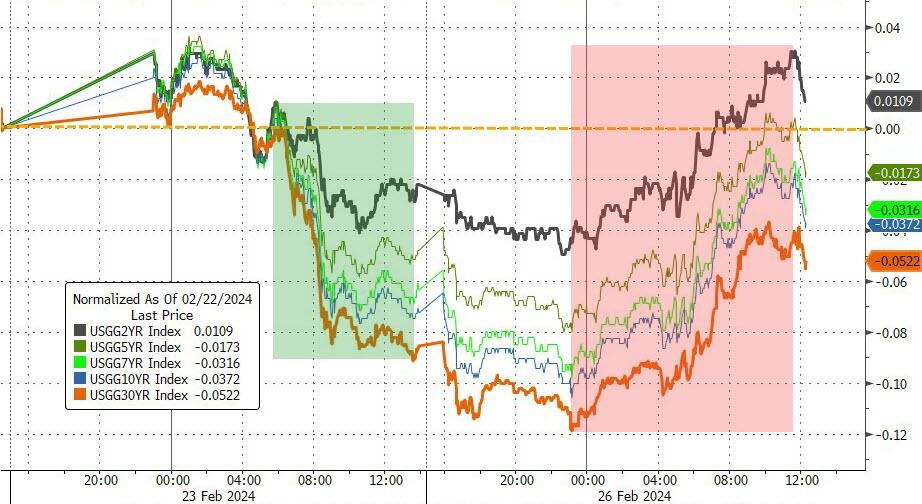
Treasury yields rose on Monday, hurting the stock market. The 10-year yield reached 4.279%, up slightly from Friday. Investors are wondering if the AI boom can continue amid economic and inflation uncertainties.
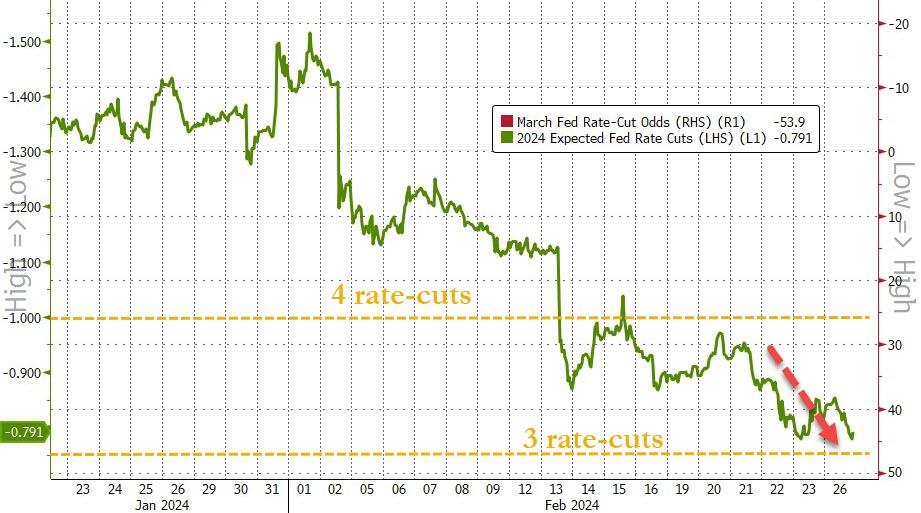
They are also looking forward to the Fed’s favorite inflation measure, the PCE index, which will be released on Thursday. Wall Street is feeling more optimistic about stocks after a strong earnings season. But the Fed is still watching inflation closely and may not cut interest rates anytime soon. The market is lowering its hopes for a rate cut this year.
There are more economic reports coming up, such as durable goods orders, wholesale inventories, consumer spending, and PCE numbers. They will give more clues about the state of the economy and inflation.
The bond market was not happy with the 2-year and 5-year auctions, which pushed yields higher across the board. This reversed some of the gains from Friday.
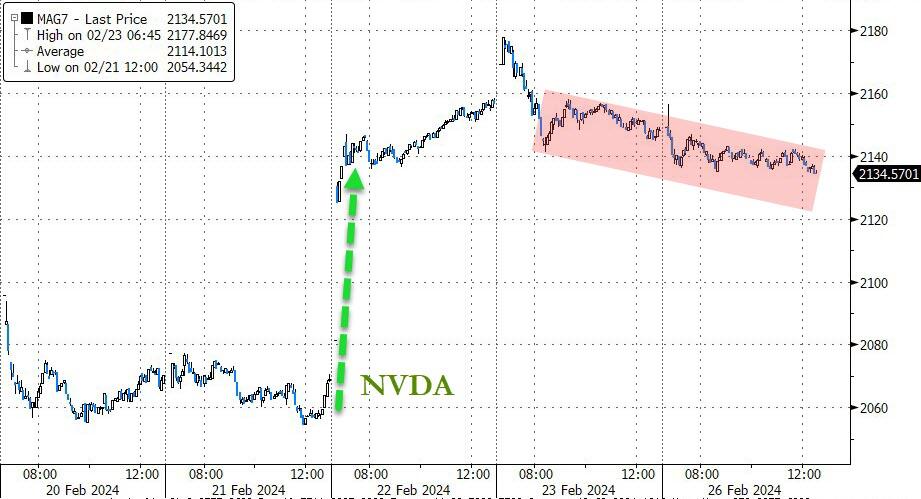
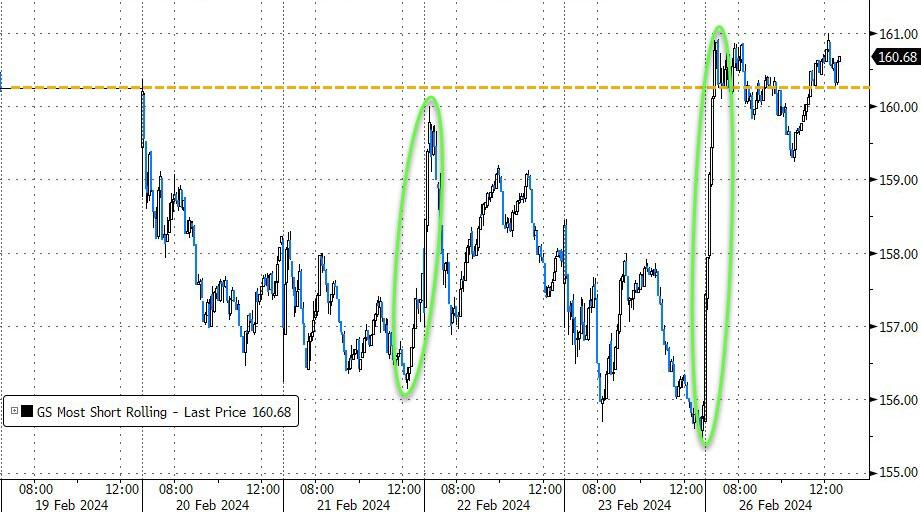
The MAG7 stocks, which include Microsoft, Apple, Google, Amazon, Facebook, Netflix, and Tesla, were weak after Nvidia dropped from its peak. But the most shorted stocks rallied, thanks to some aggressive buying. They helped the small-cap stocks, but not enough to lift the major indexes into positive territory.
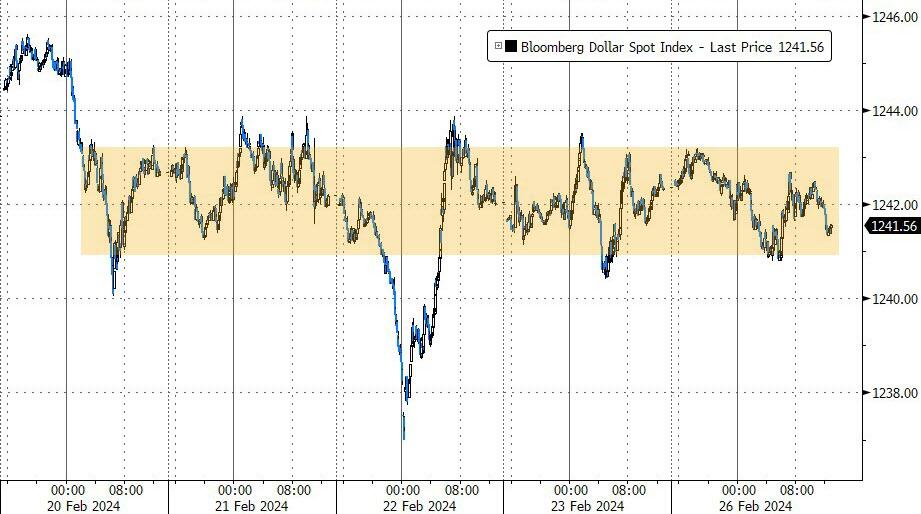
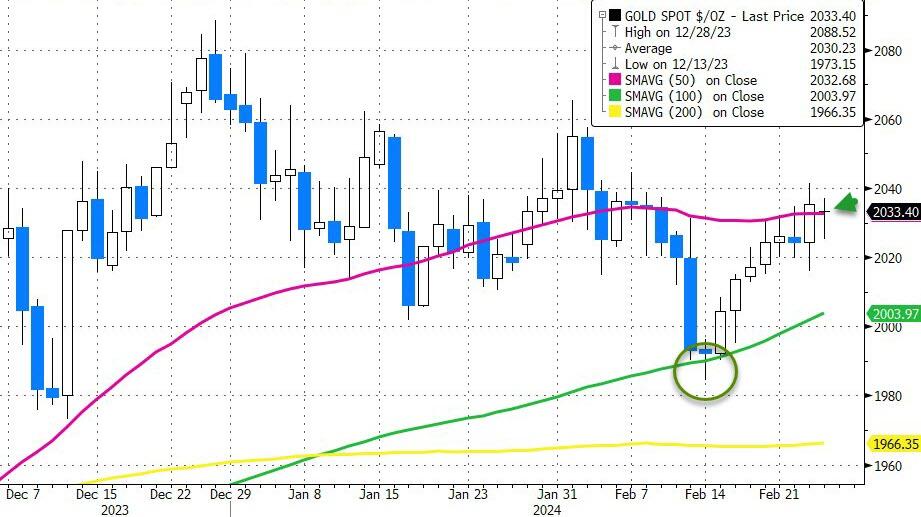
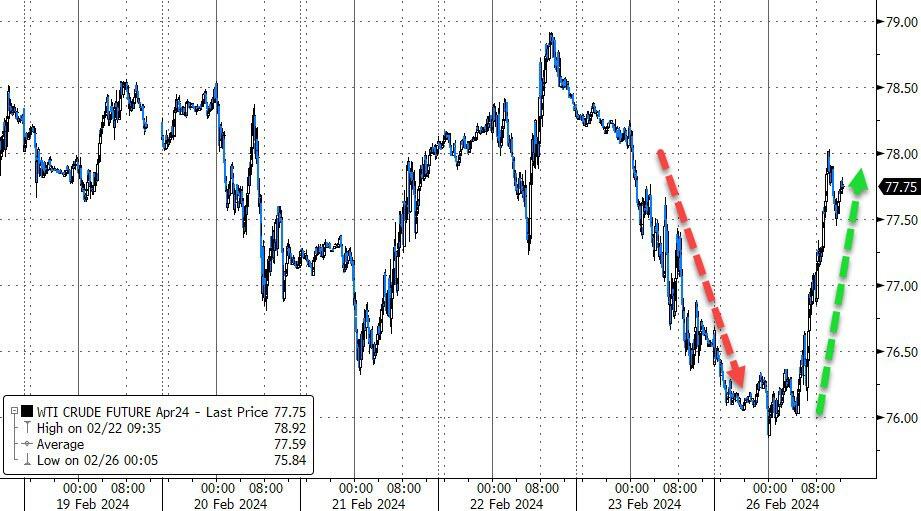
The dollar and gold were both flat for the second day in a row, while crude oil bounced back from Friday’s losses.
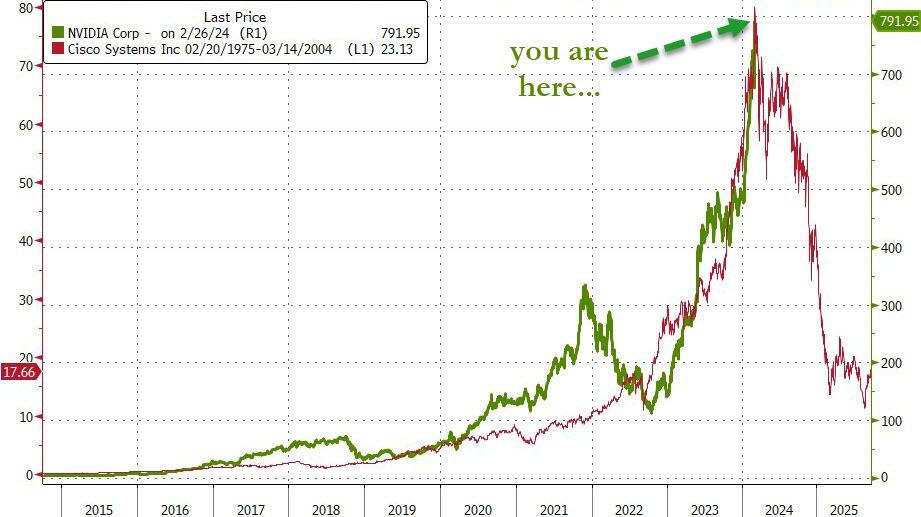
Cisco and Nvidia are still following their historical patterns.
Will they keep doing so?
2. Current “Buy” Cycles (effective 11/21/2023)
Our Trend Tracking Indexes (TTIs) have both crossed their trend lines with enough strength to trigger new “Buy” signals. That means, Tuesday, 11/21/2023, was the official date for these signals.
If you want to follow our strategy, you should first decide how much you want to invest based on your risk tolerance (percentage of allocation). Then, you should check my Thursday StatSheet and Saturday’s “ETFs on the Cutline” report for suitable ETFs to buy.
3. Trend Tracking Indexes (TTIs)
The market was weak, and the major indexes fell slightly.
Our TTIs also declined, but our outlook remains positive.
This is how we closed 2/26/2024:
Domestic TTI: +8.46% above its M/A (prior close +8.89%)—Buy signal effective 11/21/2023.
International TTI: +8.47% above its M/A (prior close +8.77%)—Buy signal effective 11/21/2023.
All linked charts above are courtesy of Bloomberg via ZeroHedge.
———————————————————-
WOULD YOU LIKE TO HAVE YOUR INVESTMENTS PROFESSIONALLY MANAGED?
Do you have the time to follow our investment plans yourself? If you are a busy professional who would like to have his portfolio managed using our methodology, please contact me directly to get more details.
—————————————————————-
Contact Ulli