
- Moving the markets
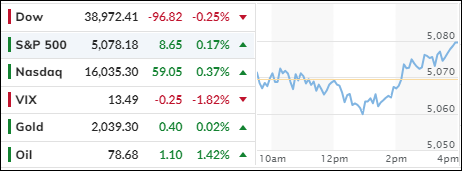
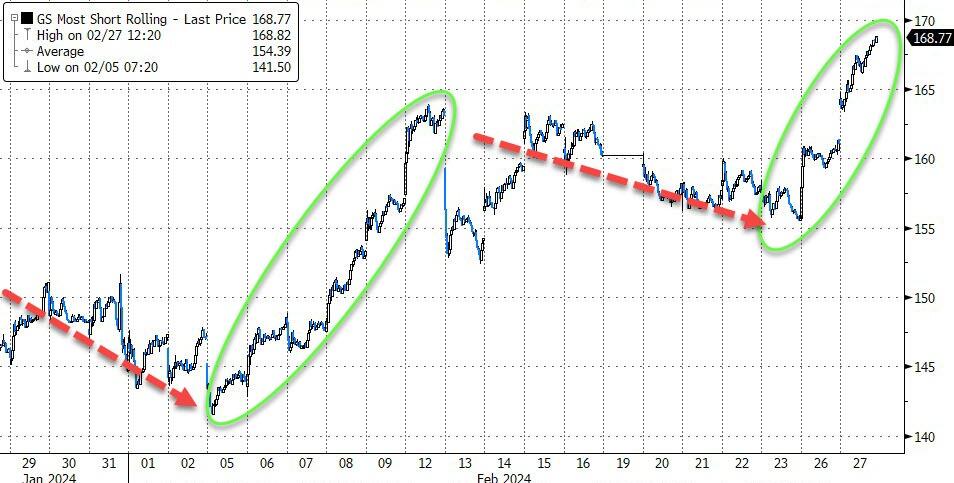
It was a dull day for the stock market, as the major indexes barely moved, and the rally took a nap. Investors were waiting for some important data coming out later this week, but they got a surprise in the last hour when the S&P 500 and the Nasdaq turned green, thanks to another short squeeze.
The market had no clear direction, as different sectors did their own thing. This followed a down day on Monday that erased the record highs that the Dow and the S&P 500 reached last week, after Nvidia impressed everyone with its earnings.
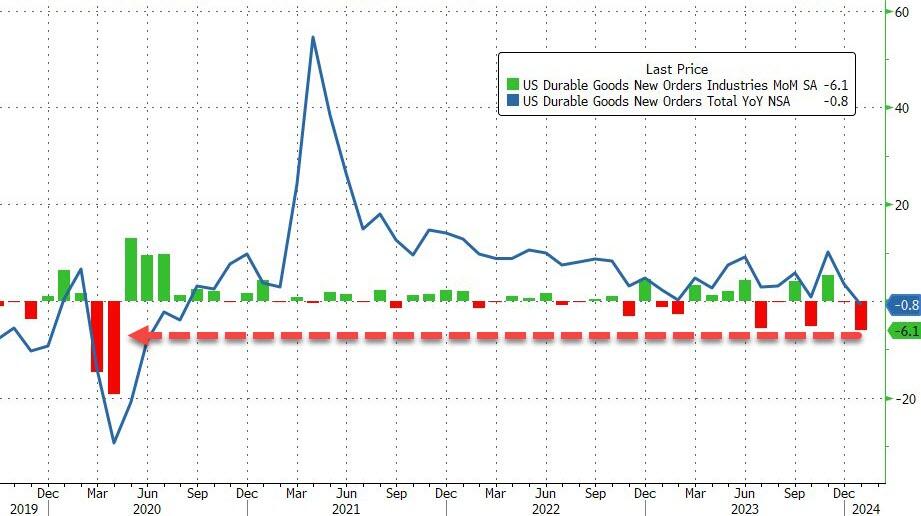
The U.S. Department of Commerce reported on Tuesday that orders for durable goods, such as cars and appliances, fell more than expected in January, mainly because people didn’t want to buy transportation.
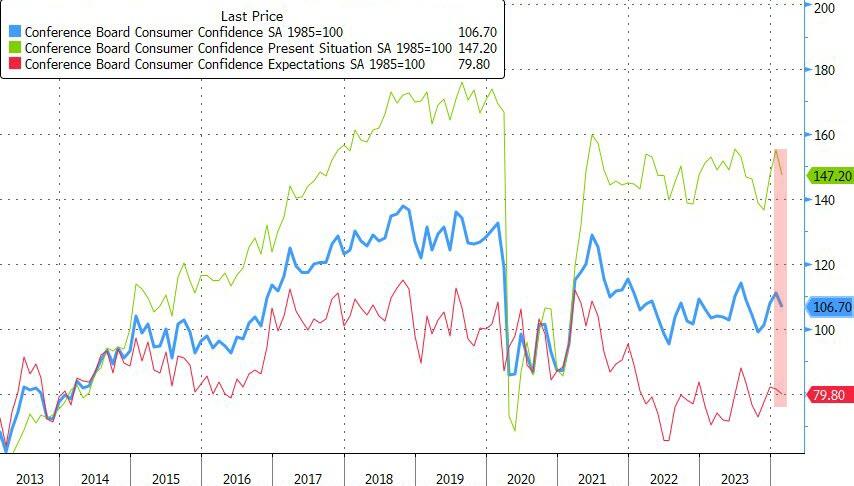
The latest consumer confidence numbers also dropped, as people worried about the job market and the political situation. The Consumer Confidence Index fell to 106.7, which was lower than the revised 110.9 in January and below the forecast of 115.1. These numbers come before the PCE index, which measures inflation, and the personal income and spending data, which will be released on Thursday.
Traders will keep an eye on these figures to see how the economy is doing and what the Fed might do next.
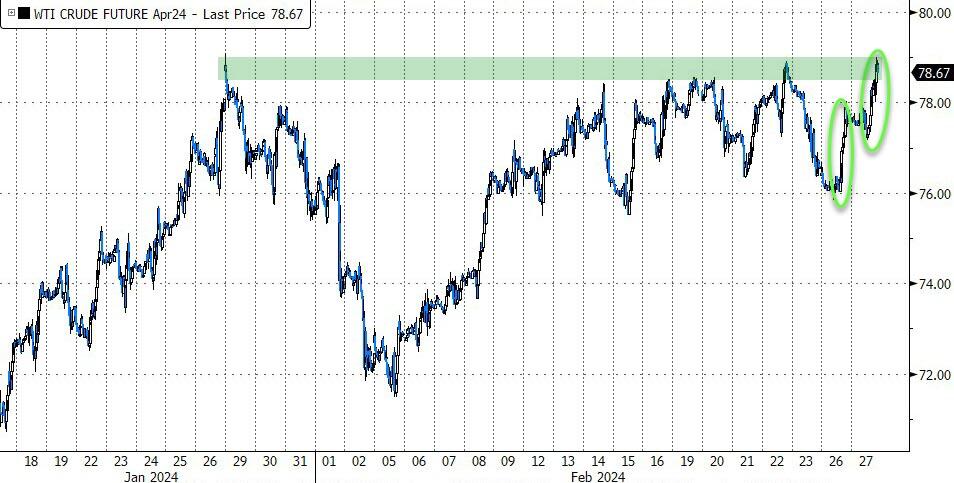
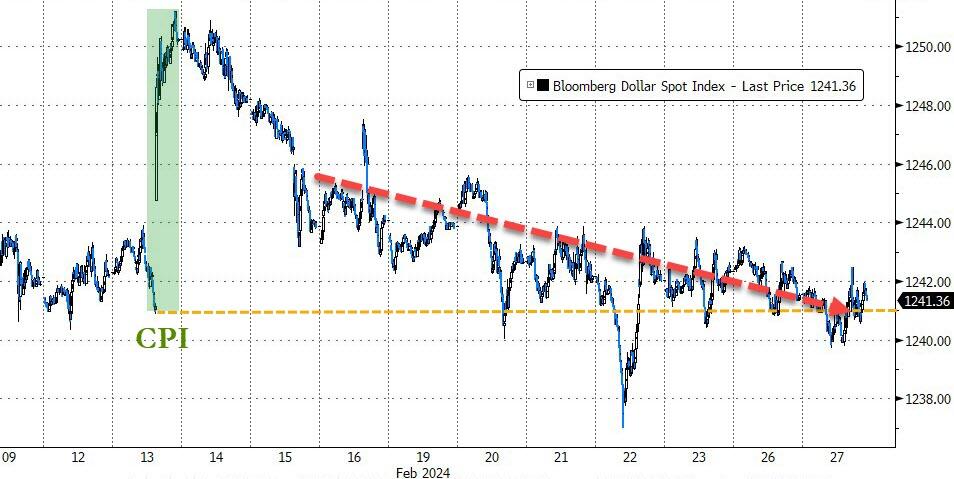
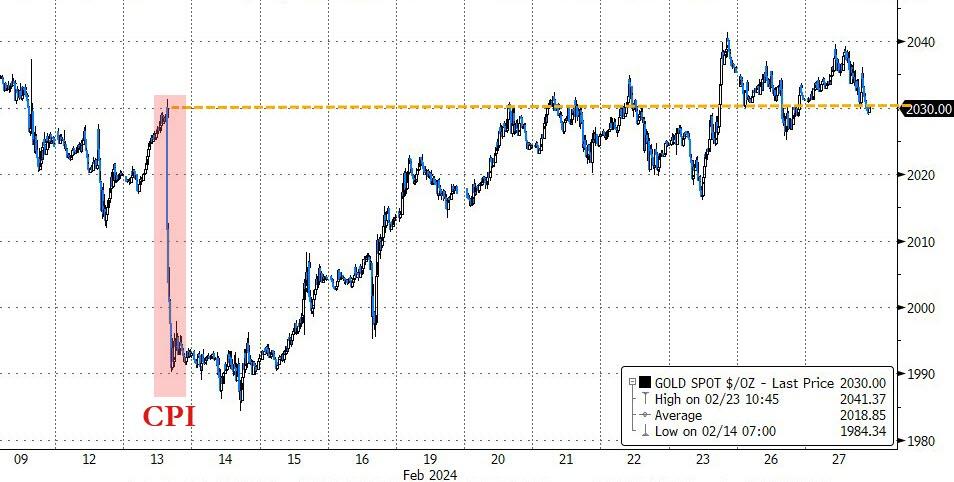
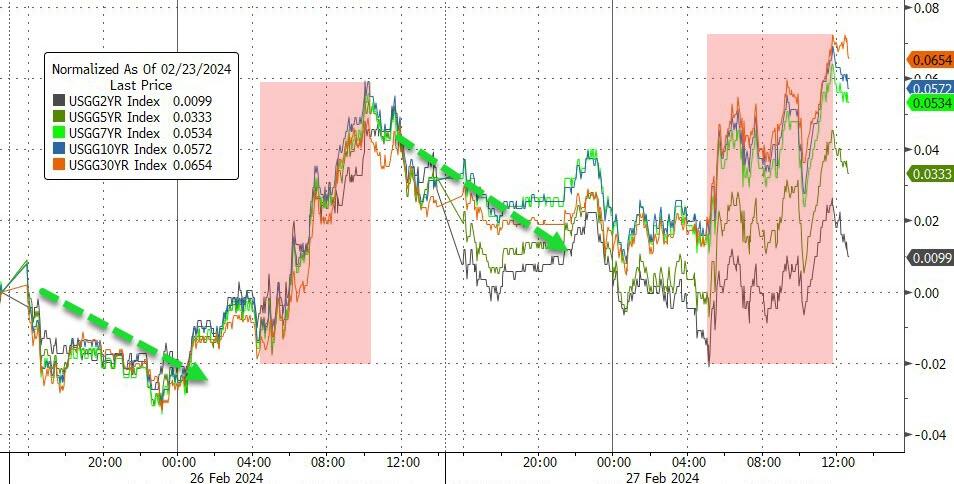
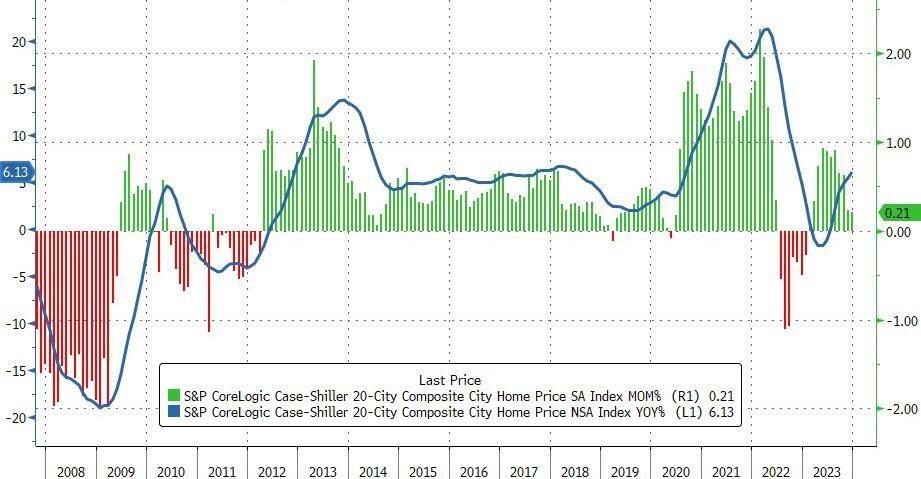
Oil prices soared to their highest level since November, the dollar kept falling, gold stayed steady, and bond yields were mixed. Durable goods orders had their worst month since the Covid lockdowns, while US Home prices kept rising for the 11th month in a row in December.
The economy was sending mixed signals, so we’ll have to wait and see if the upcoming data can clear things up.
Or will we be left in the dark?
2. Current “Buy” Cycles (effective 11/21/2023)
Our Trend Tracking Indexes (TTIs) have both crossed their trend lines with enough strength to trigger new “Buy” signals. That means, Tuesday, 11/21/2023, was the official date for these signals.
If you want to follow our strategy, you should first decide how much you want to invest based on your risk tolerance (percentage of allocation). Then, you should check my Thursday StatSheet and Saturday’s “ETFs on the Cutline” report for suitable ETFs to buy.
3. Trend Tracking Indexes (TTIs)
Today, the stock market was mostly flat, with no major changes in the Nasdaq and the S&P 500. Only the Dow showed some downward movement, dropping slightly. However, in the final hour of trading, only two indexes recovered and ended the day with small gains.
Our TTIs performed well, mirroring the market’s slight upward trend.
This is how we closed 2/27/2024:
Domestic TTI: +8.93% above its M/A (prior close +8.46%)—Buy signal effective 11/21/2023.
International TTI: +8.84% above its M/A (prior close +8.47%)—Buy signal effective 11/21/2023.
All linked charts above are courtesy of Bloomberg via ZeroHedge.
———————————————————-
WOULD YOU LIKE TO HAVE YOUR INVESTMENTS PROFESSIONALLY MANAGED?
Do you have the time to follow our investment plans yourself? If you are a busy professional who would like to have his portfolio managed using our methodology, please contact me directly to get more details.
—————————————————————-
Contact Ulli