
ETF Tracker StatSheet
You can view the latest version here.
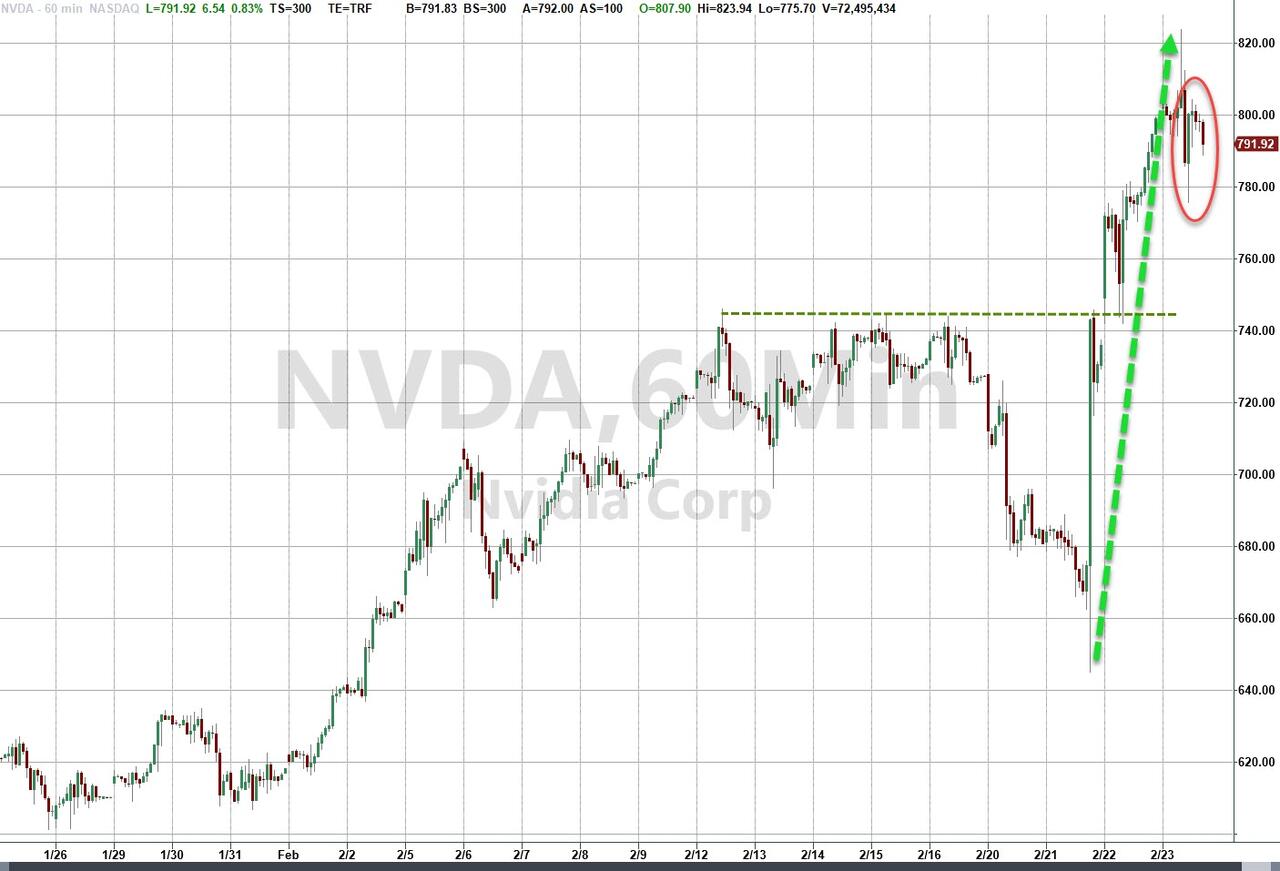
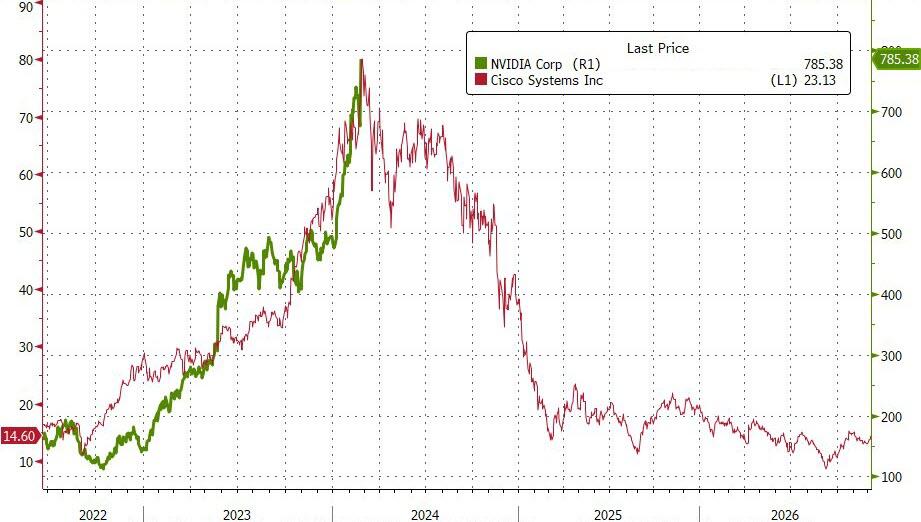
NVIDIA LEADS THE TECH RALLY, BUT WILL IT FOLLOW CISCO’S DOWNFALL?
[Chart courtesy of MarketWatch.com]
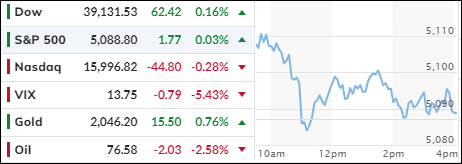
- Moving the markets
Stocks ended the week with a bang, thanks to Nvidia’s stellar earnings, that pushed its market value above $2 trillion. The chipmaker is now the third most valuable U.S. company, trailing only Microsoft and Apple.
Not bad for a company that started out making graphics cards for video games. Nvidia’s success lifted the whole market, but not everyone was happy.
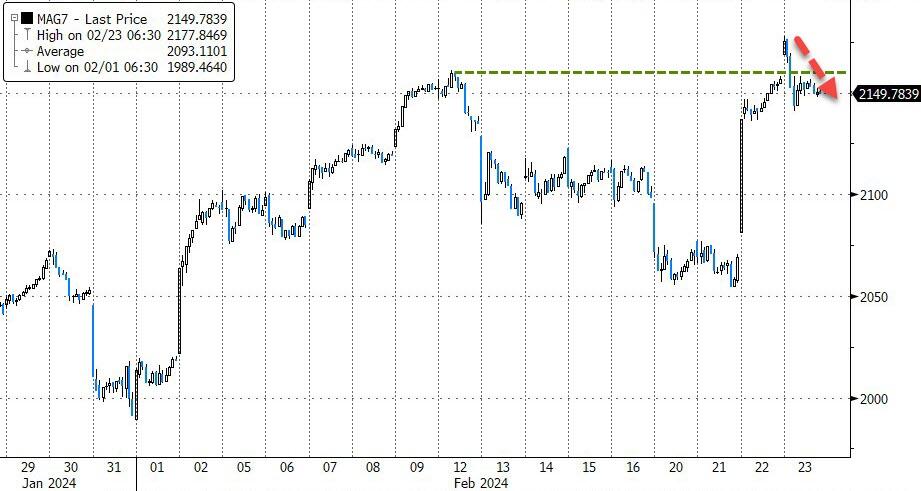
Some investors decided to cash in on the tech frenzy and sell some shares at record highs. The MAG7 stocks, the group of seven most influential tech companies, also felt the pressure and retreated from their peaks.
The S&P 500 had its best day in over a year, while the Nasdaq Composite soared 3% for its best performance in 11 months. The Dow also gained 1.2%, but the Small Caps were left behind and lost 1% for the week. It seems that size does matter, at least in the stock market.
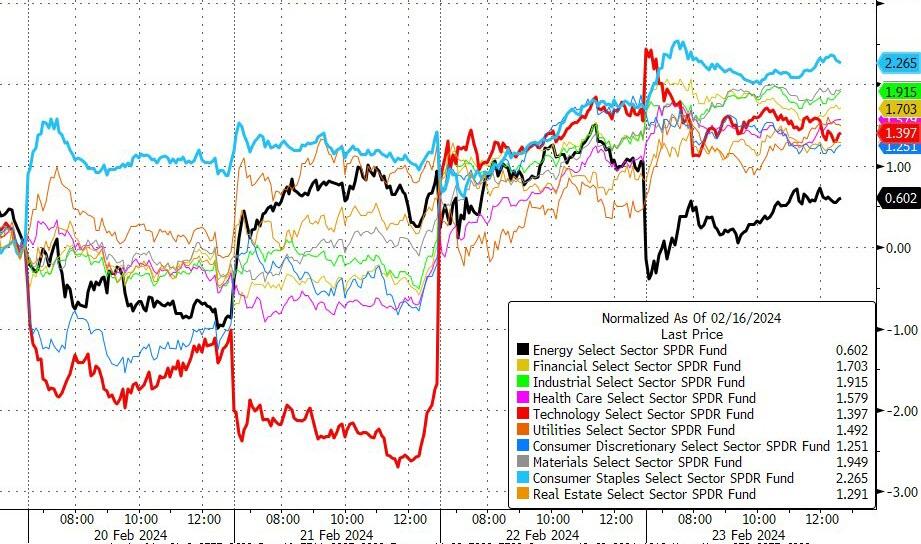
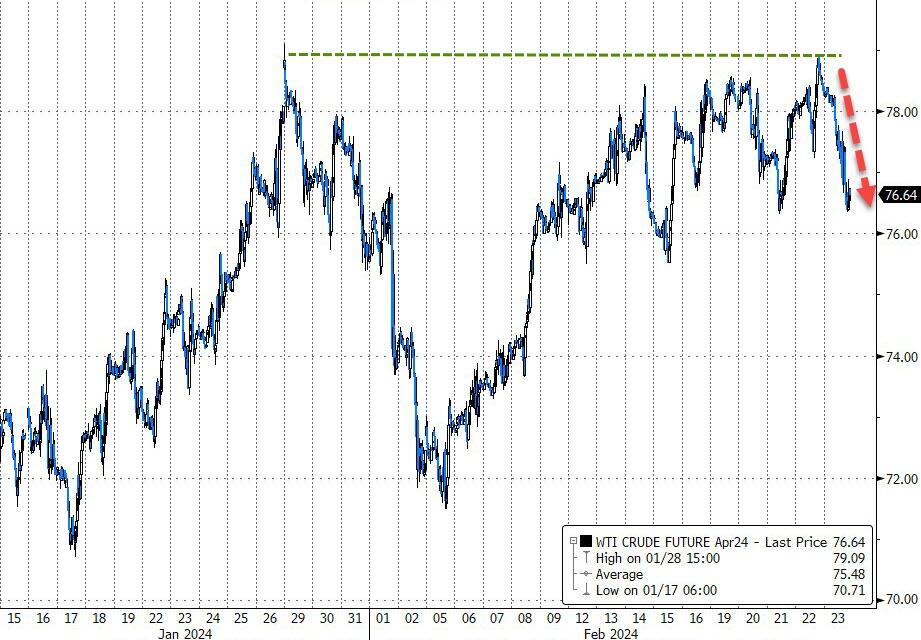
While technology was the star of the show, the best performing sector was surprisingly Consumer Staples. Maybe people were stocking up on toilet paper and canned food, just in case. Energy was the worst performer, as oil prices failed to break above January’s highs and slid lower for the week.
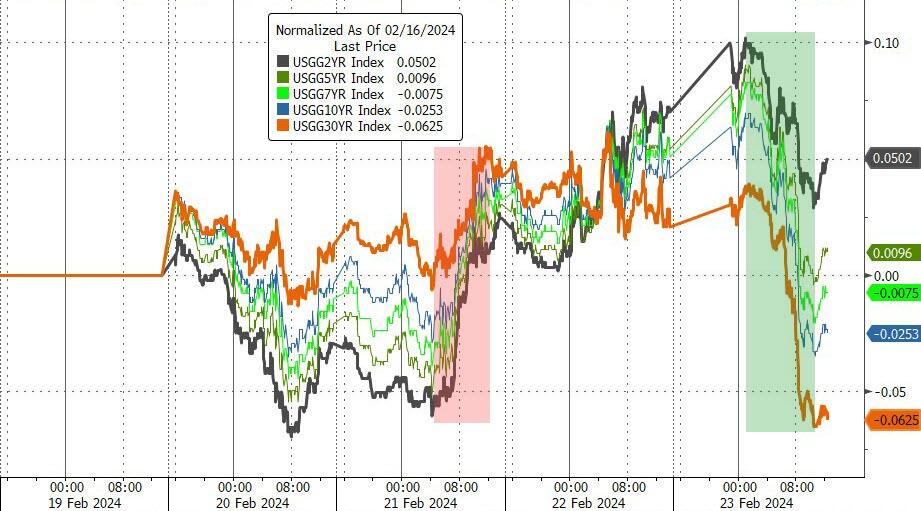
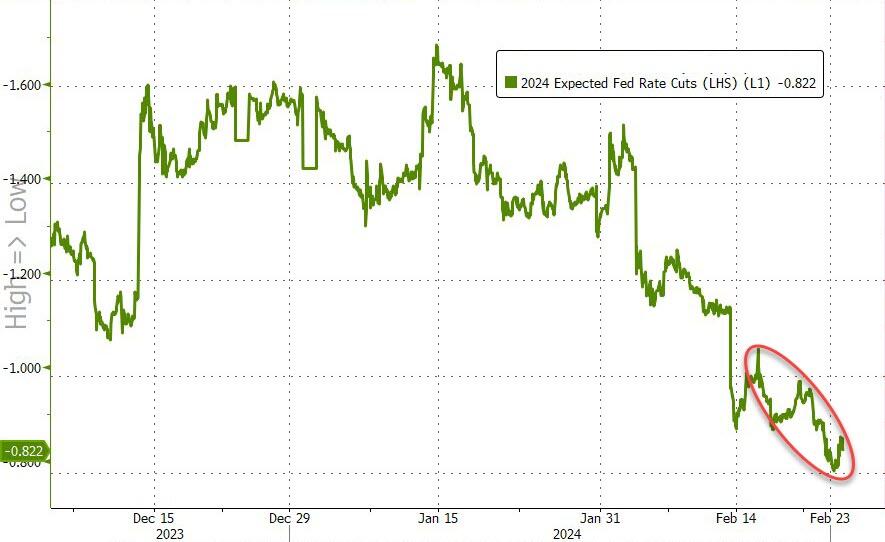
Bond yields eased from yesterday’s highs, as the market lowered its expectations for rate cuts in 2024. The odds of four cuts are now just 30%, with June being the most likely month for the first one.
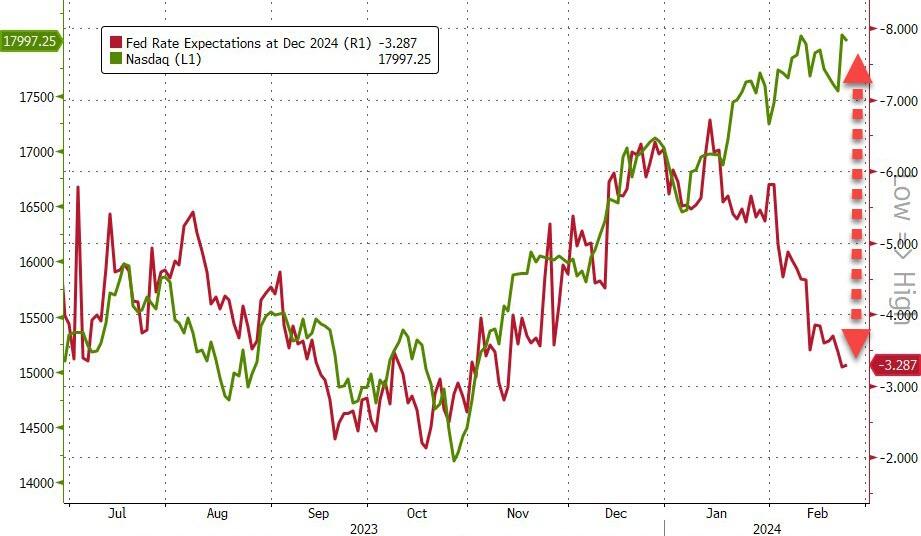
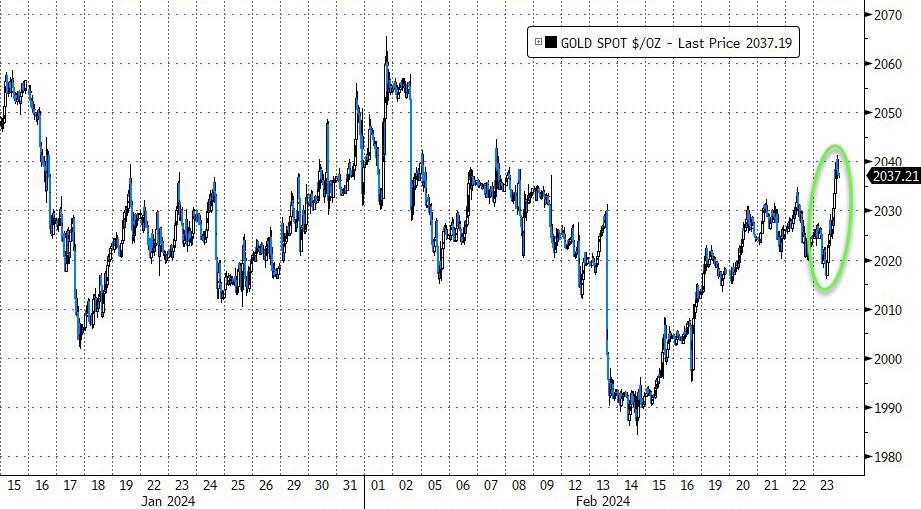
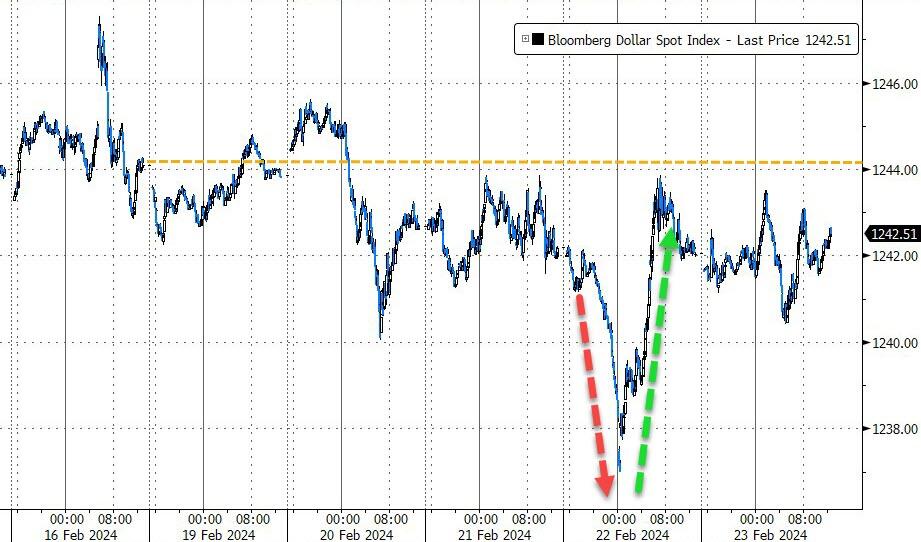
But stocks don’t seem to care about reality, they just keep going up and up. Gold had a strong week, rising 6 of the last 7 days and closing at the highest level since the beginning of the month. The dollar weakened during the week but bounced back from a sharp drop on Wednesday night.
The big question is whether Nvidia can keep up this pace and avoid the fate of Cisco, which crashed after reaching a similar valuation in 2000. This chart shows that we are getting closer to a critical point.
Are we witnessing history repeating itself, or is this time different?
2. Current “Buy” Cycles (effective 11/21/2023)
Our Trend Tracking Indexes (TTIs) have both crossed their trend lines with enough strength to trigger new “Buy” signals. That means, Tuesday, 11/21/2023, was the official date for these signals.
If you want to follow our strategy, you should first decide how much you want to invest based on your risk tolerance (percentage of allocation). Then, you should check my Thursday StatSheet and Saturday’s “ETFs on the Cutline” report for suitable ETFs to buy.
3. Trend Tracking Indexes (TTIs)
After a strong rally yesterday, stocks started the day higher but soon lost momentum. Traders took some profits, and the indexes returned to their previous levels.
Our TTIs also declined slightly and ended the day lower.
This is how we closed 2/23/2024:
Domestic TTI: +8.89% above its M/A (prior close +9.03%)—Buy signal effective 11/21/2023.
International TTI: +8.77% above its M/A (prior close +8.95%)—Buy signal effective 11/21/2023.
All linked charts above are courtesy of Bloomberg via ZeroHedge.
———————————————————-
WOULD YOU LIKE TO HAVE YOUR INVESTMENTS PROFESSIONALLY MANAGED?
Do you have the time to follow our investment plans yourself? If you are a busy professional who would like to have his portfolio managed using our methodology, please contact me directly to get more details.
—————————————————————-
Contact Ulli