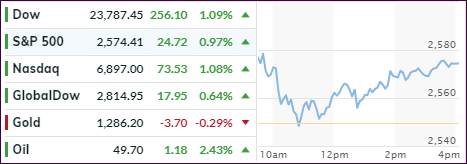
Dump And Pump; Dow Regains Part Of 500 Point Early Loss

Ulli Market Commentary Contact

[Chart courtesy of MarketWatch.com]
  1. Moving the markets

Worldwide markets rode a wild roller-coaster this morning with global systemically important banking stocks crashing hard bringing back distant memories of what we saw in 2008. It appears that banks don’t have “fortress like balance sheets,” which increases the odds of more fallout to come.

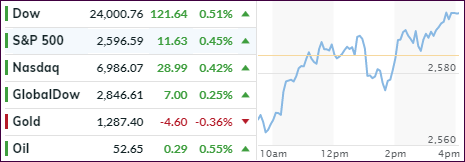
Global stock markets retreated in sync with the Dow getting hammered at the tune of 500 points with the Nasdaq and S&P 500 experiencing not only their own sharp declines, but also dipping below their respective 200-day M/As. However, as if by magic, most of the losses were made up during an afternoon levitation, which made the session look not as bad as it was. Makes me wonder how much of the sudden support came from the Plunge Protection Team (PPT) as opposed to dip buyers on the prowl.

Assisting in the early sell-off were earnings disappointments by 3M and Caterpillar (CAT) with the former not only missing Q3 earnings but also slashing guidance, while the latter warned about rising costs. Especially Cat’s chart is a picture of ugliness, even to the most casual observer and may very well set the tone for this earnings season.

Today’s session seems to confirm a change in sentiment and mindset, which some analysts referred to as “fade bounces,” “sell the rips” and “take down net exposure to new lows.” Others see the mantra changing from “growing faster than we are tightening” to “tightening ourselves in a slowdown.

Even the much-hyped hope bounce of a one-day 4.1% in the Chinese Markets came to an end, and stocks resumed their wild ride to the downside. Asian shares in general dropped -2.1% to a 1.5 year low and are in danger of slipping into a bear market. Europe is facing a similar situation, as their tech sector just generated a “Death Cross” bearish signal.

I took the opportunity to liquidate our final position in “broadly diversified domestic equity ETFs,” as our Domestic TTI slipped deeper into bearish territory (see section 3). In my view, and judging by the above goings on, the odds of further downside moves have increased, especially if we start to catch down to the rest of the world. That’s why we will stand aside for the time being and establish new positions once our Domestic TTI crosses back above its trend line.

This is not the time to be a hero but to be more concerned with preservation of capital. If you were in the market during the 2008 disaster, then this reminder should ring a bell that history may not rhyme but has a funny way of repeating itself.

Read More

Wrestling For Domination

Ulli Market Commentary Contact

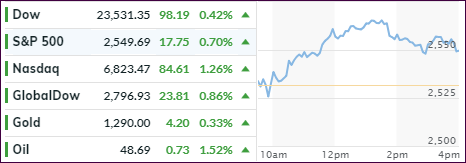
[Chart courtesy of MarketWatch.com]
  1. Moving the markets

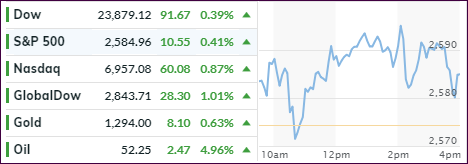
We saw another see-saw ride on Wall Street with bulls and bears engaging in a continuous battle for domination. There were no clear winners and some of the intra-day rally attempts fell short of pushing the major indexes above their respective unchanged lines. The exception was the Nasdaq, which managed to eke out a small gain, while the S&P 500 scored its 4th straight loss.

So, the tug-of-war continued, but I took the opportunity to lighten up some more on our few remaining positions, as both of our Trend Tracking Indexes (TTIs) headed deeper into bearish territory with the Domestic one now closing in on a level that requires an all-cash position regarding “broadly diversified domestic ETFs.”

We are at an inflection point where the markets can still break out either way. The only bullish component I currently see is the upcoming earnings season, which could provide a boost to the markets leaving open the question as to whether this would only be of a short-term nature or have enough strength to get our Domestic TTI back on the bullish side of the trend line.

In the meantime, this current choppiness may stay with us until a breakout occurs, either to the downside or to the upside. Right now, downside momentum seems to have the upper hand as my indicators show, along with the US Financial Conditions Index.

Read More

ETFs On The Cutline – Updated Through 10/19/2018

Ulli ETFs on the Cutline Contact

Below, please find the latest High-Volume ETF Cutline report, which shows how far above or below their respective long-term trend lines (39-week SMA) my currently tracked ETFs are positioned.

This report covers the HV ETF Master List from Thursday’s StatSheet and includes 366 High Volume ETFs, defined as those with an average daily volume of more than $5 million, of which currently 70 (last week 60) are hovering in bullish territory. The yellow line separates those ETFs that are positioned above their trend line (%M/A) from those that have dropped below it.

Take a look:

The HV ETF Master Cutline Report

In case you are not familiar with some of the terminology used in the reports, please read the Glossary of Terms.

If you missed the original post about the Cutline approach, you can read it here.

ETF Tracker Newsletter For October 19, 2018

Ulli ETF Tracker Contact

ETF Tracker StatSheet

https://theetfbully.com/2018/10/weekly-statsheet-for-the-etf-tracker-newsletter-updated-through-10-18-2018/

BULL-BEAR STRUGGLE

[Chart courtesy of MarketWatch.com]
  1. Moving the markets

Bulls and bears were engaged in a tug-of-war during the entire session with the bulls showing strength early on but fading mid-day and briefly dropping into red numbers, as the bears gained the upper hand. In the end, the major indexes closed mixed and off the day’s highs with the S&P 500 and Nasdaq remaining in the red.

Today marked the 31st anniversary of the 1987 crash, which was also the period during which I fine-tuned my Trend Tracking Indexes (TTIs) to avoid participation in financial disasters like we saw at that time.

Markets were not influenced by that dubious anniversary but concerns about weak housing data and its potential fallout were weighing on traders’ minds. Existing home sales dropped for the 7th straight month and slumped 3.4% in August to a level last seen in November 2015, as Home-builder stocks collapsed. Considering the barrage of poor housing data sets we saw over the past week, there is bound to be some negative effect on GDP data, especially when considering the additional drag from the auto sector.

To be clear, it’s not just American car makers that are suffering, the Germans have joined the crowd. After BMWs recent tumble, it was Mercedes’ turn by warning that 2018 results would be “significantly” below prior year levels. Ouch!

In the end, the major indexes are clinging to key technical levels giving no clue as to any directional guidance. We are still at a point where either bears or bulls could be dominating, which means we will remain on hold with further commitments until the confusion clears.

Read More

Weekly StatSheet For The ETF Tracker Newsletter – Updated Through 10/18/2018

Ulli ETF StatSheet Contact

ETF Data updated through Thursday, October 18, 2018

Methodology/Use of this StatSheet:

  1. From the universe of over 1,800 ETFs, I have selected only those with a trading volume of over $5 million per day (HV ETFs), so that liquidity and a small bid/ask spread are assured.
  2. Trend Tracking Indexes (TTIs)

Buy or Sell decisions for Domestic and International ETFs (section 1 and 2), are made based on the respective TTI and its position either above or below its long-term M/A (Moving Average). A crossing of the trend line from below accompanied by some staying power above constitutes a “Buy” signal. Conversely, a clear break below the line constitutes a “Sell” signal. Additionally, I use a 7.5% trailing stop loss on all positions in these categories to control downside risk.

  1. All other investment arenas do not have a TTI and should be traded based on the position of the individual ETF relative to its own respective trend line (%M/A). That’s why those signals are referred to as a “Selective Buy.” In other words, if an ETF crosses its own trend-line to the upside, a “Buy” signal is generated. Since these areas tend to be more volatile, I recommend a wider trailing sell stop of 7.5% -10% depending on your risk tolerance.

If you are unfamiliar with some of the terminology, please see Glossary of Terms and new subscriber information in section 9.


  1. DOMESTIC EQUITY ETFs: SELL — since 10/12/2018

Click on chart to enlarge

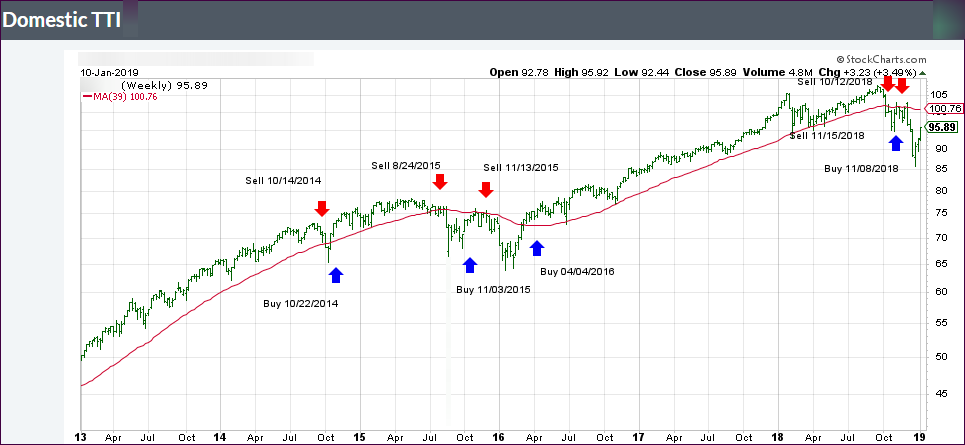
Our main directional indicator, the Domestic Trend Tracking Index (TTI-green line in the above chart) is now positioned below its long-term trend line (red) by -1.22% after having generated a new Domestic “Sell” signal effective 10/12/18 as posted.

Read More

Resuming The Bearish Trend

Ulli Market Commentary Contact

[Chart courtesy of MarketWatch.com]
  1. Moving the markets

There was no rebound in sight anywhere, as the major indexes opened below their respective unchanged lines, headed south and bounced around the day’s lows without ever threatening the downward momentum.

The S&P 500 has now lost 9 out of the past 11 trading days and closed today right at its 200-day M/A. That leaves open the question as to whether this level will again serve as a springboard for further advances or will simply be a momentary resting place before the index dives into bear market territory.

The Dow was off some 450 points at its low, as worries about interest rates and global growth took center stage and removed any bullish sentiment. For sure, this move ended Tuesday’s epic short squeeze, which was declared the biggest one since election day and which has now gone through a total reversal.

It all started with Chinese equites doing their best interpretation of a swan dive with the Yuan joining the party. For background, the Chinese markets have been nothing short of a bloodbath this year with their equivalent of the ‘Nasdaq’ having lost some -35% YTD. Taking a clue from China, Europe followed suit with their indexes not only sinking for the session but diving into the close.

As ZH, pointed out, bond yields spiked yesterday to catch up with stocks, then recoupled and fell today in sync with equities. YTD, 10-year yield has come off its highs, at least for the time being, while the US dollar continues to hover in its trading range, although at the high end.

What could spark a sudden rebound in equities?

While a surprisingly strong earnings season may rank at the top of the list, another reason could be the ending of the blackout period companies have put in place that limits trading from a few weeks before earnings are released until shortly thereafter. Whether these two possibilities are enough to overcome weak economic data and lack of global growth remains to be seen.

Our Trend Tracking Indexes (TTI) continue to support the bearish theme, as you can see in section 3.

Read More