Vicious Bears: Major Indexes Bounce, Fade And Dive

Ulli Market Commentary Contact

[Chart courtesy of MarketWatch.com]
  1. Moving the markets

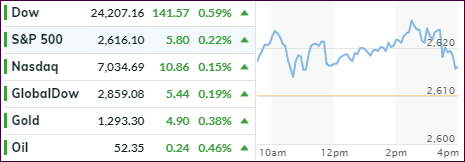
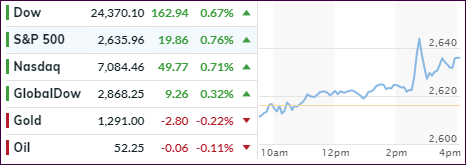
A nice early morning bounce seemed to have a soothing effect on the bulls, with the Dow up almost 400 points. Unfortunately, that did not last, as a mid-day fade took the major indexes back to the unchanged line when, suddenly, downward momentum accelerated pushing the Dow momentarily to -500 points, before a last-minute rally limited the day’s damage.

Nevertheless, the trading range for the Dow was over 900 points leaving all indexes in the red for the session. As I mentioned before, when we are in bear market territory, as determined by our Trend Tracking Indexes (section 3), not only can anything happen but also with a speed and magnitude that can be simply breathtaking, as we saw this afternoon. The adage that “stocks take the escalator up and the elevator down” certainly rang true today.

Things started to collapse after US-China trade headlines suggested that Trump might put tariffs on ‘all’ Chinese goods, if his next scheduled meeting with the Chinese Premier Xi does not bring the desired results. Other news about an UK digital service tax did not encourage buyers to put their chips down.

The VIX spiked above 25, and the widely held FANG stocks continued their swan dive and are now down -24% from their highs in late September. All 4 of them are now in bear market territory and have come off their highs as follows: FB (-35.5%), AMZN (-25.9%), NFLX (-33.3%), GOOGL (-20.3%).

The bulls have now set their sights on hopes of good news from the ongoing earnings season, expecting bullish momentum to be restored. The other possible game changer could be the expiration of the blackout period, which is the time frame just prior and shortly after earnings season during which corporations suspend stock buybacks. As these stocks exit this period, it is assumed that their historical buying spree will continue and lift overall market sentiment.

Right now, however, the bears maintain the upper hand, and we will watch this debacle unfold from the sidelines.

Read More

ETFs On The Cutline – Updated Through 10/26/2018

Ulli ETFs on the Cutline Contact

Below, please find the latest High-Volume ETF Cutline report, which shows how far above or below their respective long-term trend lines (39-week SMA) my currently tracked ETFs are positioned.

This report covers the HV ETF Master List from Thursday’s StatSheet and includes 366 High Volume ETFs, defined as those with an average daily volume of more than $5 million, of which currently 40 (last week 70) are hovering in bullish territory. The yellow line separates those ETFs that are positioned above their trend line (%M/A) from those that have dropped below it.

Take a look:

The HV ETF Master Cutline Report

In case you are not familiar with some of the terminology used in the reports, please read the Glossary of Terms.

If you missed the original post about the Cutline approach, you can read it here.

ETF Tracker Newsletter For October 26, 2018

Ulli ETF Tracker Contact

ETF Tracker StatSheet

https://theetfbully.com/2018/10/weekly-statsheet-for-the-etf-tracker-newsletter-updated-through-10-25-2018/

ANOTHER DUMP AND A FAILED PUMP TO END THE WEEK

[Chart courtesy of MarketWatch.com]
  1. Moving the markets

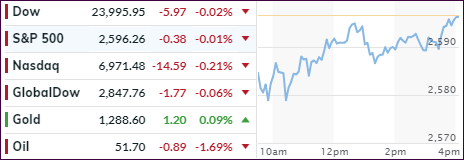
Volatility continued with the week ending on a sour note, as today’s early morning dump had the Dow down some 400 points, when suddenly a remarkable recovery out of nowhere turned the markets around reducing the Dow’s loss to some 80 points. As had been the case all week, the bears exerted their domination again by pushing the index back down to a closing loss of almost 300 points (-1.19%), while the S&P and Nasdaq fared worse, as the chart above shows. For the week, the S&P 500 surrendered -3.9%.

Getting things started to the downside were disappointing earnings reports by the tech powerhouses Amazon (-7.82%) and Google (-2.20%) with Amazon now entering bear market territory joining SmallCaps and the S&P 500. Globally, the fallout was even more dramatic, as over $8 trillion in asset values were wiped out.

All the major indexes have settled below their respective 200-day M/As with the S&P having dropped 15 times this month which, according to ZH, was the most for a full month since October 2008. However, this ugliness was broad based as their latest summary shows:

  1. Dow down 9% from record high (down 4 of last 5 weeks)
  2. S&P down 10.1% from record high (down 4 of last 5 weeks)
  3. Nasdaq down 13% from record high (down 4 weeks in a row)
  4. Dow Transports down 15.2% from record high (down 6 weeks in a row)
  5. Small Caps down 15.8% from record high (down 6 weeks in a row)

Right now, it looks to me that this volatility will stay with us at least until election time when, depending on the outcome and the interpretation thereof, should shed some light as whether we’ll be going further south or giving the bulls a chance to recover by pulling the market out of its doldrums and into the widely expected year-end rally.

Right now, it’s good to be on the sidelines.

Read More

Weekly StatSheet For The ETF Tracker Newsletter – Updated Through 10/25/2018

Ulli ETF StatSheet Contact

ETF Data updated through Thursday, October 25, 2018

Methodology/Use of this StatSheet:

  1. From the universe of over 1,800 ETFs, I have selected only those with a trading volume of over $5 million per day (HV ETFs), so that liquidity and a small bid/ask spread are assured.
  2. Trend Tracking Indexes (TTIs)

Buy or Sell decisions for Domestic and International ETFs (section 1 and 2), are made based on the respective TTI and its position either above or below its long-term M/A (Moving Average). A crossing of the trend line from below accompanied by some staying power above constitutes a “Buy” signal. Conversely, a clear break below the line constitutes a “Sell” signal. Additionally, I use a 7.5% trailing stop loss on all positions in these categories to control downside risk.

  1. All other investment arenas do not have a TTI and should be traded based on the position of the individual ETF relative to its own respective trend line (%M/A). That’s why those signals are referred to as a “Selective Buy.” In other words, if an ETF crosses its own trendline to the upside, a “Buy” signal is generated. Since these areas tend to be more volatile, I recommend a wider trailing sell stop of 7.5% -10% depending on your risk tolerance.

If you are unfamiliar with some of the terminology, please see Glossary of Terms and new subscriber information in section 9.


  1. DOMESTIC EQUITY ETFs: SELL — since 10/12/2018

Click on chart to enlarge

Our main directional indicator, the Domestic Trend Tracking Index (TTI-green line in the above chart) is now positioned below its long-term trend line (red) by -4.07% after having generated a new Domestic “Sell” signal effective 10/12/18 as posted.

Read More

Crawling Out Of A Deep Hole

Ulli Market Commentary Contact

[Chart courtesy of MarketWatch.com]
  1. Moving the markets

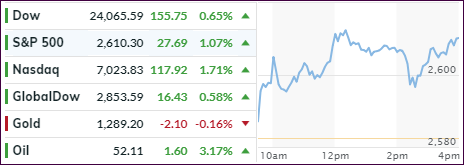
Having been involved in the investment methodology of trend tracking for the past 30 years, I have seen my share of violent market swings in both directions. I was reminded of that when, after yesterday’s 600-point drubbing of the Dow, today’s rebound, or was it a dead-cat-bounce, recovered about 400 points.

These kinds of jaw dropping sell-offs followed by impressive comebacks are typical of the swings you see when we drop into bearish territory, as defined by my Trend Tracking Indexes (TTIs), which have been hovering below their respective trend lines since last week.

Once we are “below” the line, it does not mean that this correction will turn into a full-fledged bear market, it could simply be an overreaction to negative news. However, at that point the odds are increased that more downside activity could be in the cards as conflicting factors and uncertainty favor the bearish crowd.

On the other hand, bull markets have found new life when things looked bad and sellers had run out of ammunition. Today’s rebound is totally inconclusive as to which directional path the markets will take. Using our trend tracking methodology, we will let the markets tell us when it’s time to act.

Should this rebound have legs and generate more upward momentum, we will see an eventual crossing of our TTIs (section 3) back into bullish territory, which will then generate a new “Buy” signal for the affected asset classes. Right now, however, the bears have the upper hand, and we will wait and observe this tug-of-war, which is sure to continue until a directional breakout will clarify the current murky picture.

Read More

Chaos: Accelerating To The Downside And Diving Into The Close

Ulli Market Commentary Contact

[Chart courtesy of MarketWatch.com]
  1. Moving the markets

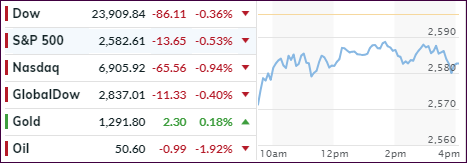
By the chart above, you would not know that we had a positive opening thanks to Boeing’s encouraging earnings report which, at the end of this session, turned into a tiny unimportant speck in the rear-view mirror. After a mid-day bounce, bearish momentum gathered strength and south we went, at first slowly and then via a swan dive into close with all major indexes suffering heavy losses.

The Dow and S&P 500 are now negative for the year, while the Nasdaq slipped into correction territory, which is defined as a pullback of at least 10% below its August high; it’s down -12.6% from that level. In fact, 70% of S&P 500 stocks are already in a correction.

So, it’s not surprising to hear that selling on the NYSE reached panic-like proportions with the path to the exit doors getting increasingly crowed. That supports my long-held belief that an investor should only be dealing with high-volume ETFs, such as the ones I feature in Thursday’s StatSheet.

In my advisor practice, we remain in cash on the sidelines and will look for opportunities once our TTIs (section 3) move back into bullish territory.

Not helping matters, and putting another nail in the housing market coffin, were reports showing that New Home Sales crashed in September with supply soaring. New Home Sales plunged to their lowest since December 2016 and tumbled 5.5% MoM. You can read more details here.

Some interesting commentary always appears when markets hit the skids. Here are two that are worthy of mentioning:

  1. I want to reiterate that there is unlimited downside risk in the market right now, and I don’t think it’s being respected. It’s not until afterwards that they ask, “what happened??”
  2. We have maintained…and still maintain… the same philosophy that we’d adopted for these past several weeks and months: that this is a bear market and that periods of strength can be and indeed must be used to sell into… to lighten up existing long positions if one is still reasonably long and to sell short if one is of that mind. We stand by that thesis. But for a day or two or three, a bounce is in order.

I must agree with these comments, since it appears that the bears are clearly in charge when not just looking at the domestic area but at the global markets as well. The aging and failing banking systems seem to be the front runners, with Deutsche Bank following the path of Lehman as this chart shows. With over $50 trillion in derivatives exposure, it looks to be the proverbial bug looking for a windshield.

ZH summed up the ugliness of the day like this:

  1. Small Caps down 15% from highs
  2. Dow Transports down 14.5% from highs
  3. Nasdaq is now down 12.25% from the highs – enters correction
  4. S&P down 9% from highs
  5. Dow down 8.5% from highs

Back to the banks. Global systemically Important Banks have now crashed 30% since Trump’s election. Does that mean there will be another 2008 style bailout forthcoming?

Read More