
- Moving the markets
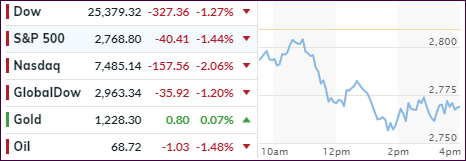
There was no rebound in sight anywhere, as the major indexes opened below their respective unchanged lines, headed south and bounced around the day’s lows without ever threatening the downward momentum.
The S&P 500 has now lost 9 out of the past 11 trading days and closed today right at its 200-day M/A. That leaves open the question as to whether this level will again serve as a springboard for further advances or will simply be a momentary resting place before the index dives into bear market territory.
The Dow was off some 450 points at its low, as worries about interest rates and global growth took center stage and removed any bullish sentiment. For sure, this move ended Tuesday’s epic short squeeze, which was declared the biggest one since election day and which has now gone through a total reversal.
It all started with Chinese equites doing their best interpretation of a swan dive with the Yuan joining the party. For background, the Chinese markets have been nothing short of a bloodbath this year with their equivalent of the ‘Nasdaq’ having lost some -35% YTD. Taking a clue from China, Europe followed suit with their indexes not only sinking for the session but diving into the close.
As ZH, pointed out, bond yields spiked yesterday to catch up with stocks, then recoupled and fell today in sync with equities. YTD, 10-year yield has come off its highs, at least for the time being, while the US dollar continues to hover in its trading range, although at the high end.
What could spark a sudden rebound in equities?
While a surprisingly strong earnings season may rank at the top of the list, another reason could be the ending of the blackout period companies have put in place that limits trading from a few weeks before earnings are released until shortly thereafter. Whether these two possibilities are enough to overcome weak economic data and lack of global growth remains to be seen.
Our Trend Tracking Indexes (TTI) continue to support the bearish theme, as you can see in section 3.
- ETFs in the Spotlight
In case you missed the announcement and description of this section, you can read it here again.
It features 10 broadly diversified and sector ETFs from my HighVolume list as posted every Saturday. Furthermore, they are screened for the lowest MaxDD% number meaning they have been showing better resistance to temporary sell offs than all others over the past year.
The below table simply demonstrates the magnitude with which some of the ETFs are fluctuating regarding their positions above or below their respective individual trend lines (%M/A). A break below, represented by a negative number, shows weakness, while a break above, represented by a positive percentage, shows strength.
For hundreds of ETF choices, be sure to reference Thursday’s StatSheet.
Year to date, here’s how our candidates have fared so far:
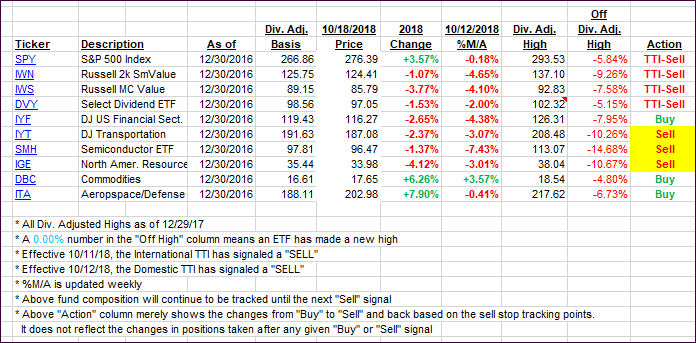
Again, the %M/A column above shows the position of the various ETFs in relation to their respective long-term trend lines, while the trailing sell stops are being tracked in the “Off High” column. The “Action” column will signal a “Sell” once the -8% point has been taken out in the “Off High” column. For more volatile sector ETFs, the trigger point is -10%.
- Trend Tracking Indexes (TTIs)
Our Trend Tracking Indexes (TTIs) took a dive deeper into bear market territory. The International one has been pretty much entrenched below the line, while the Domestic one has been bouncing above and below it.
I’d like to see some more staying power below the trend line, before I will liquidate the remainder of our holdings and validate the current domestic “Sell” signal.
Here’s how we closed 10/18/2018:
Domestic TTI: -1.22% below its M/A (last close +0.06%)—Sell signal effective 10/12/2018
International TTI: -3.66% below its M/A (last close -2.61%)—Sell signal effective 10/11/2018
Disclosure: I am obliged to inform you that I, as well as my advisory clients, own some of the ETFs listed in the above table. Furthermore, they do not represent a specific investment recommendation for you, they merely show which ETFs from the universe I track are falling within the guidelines specified.
Contact Ulli