
- Moving the markets
Worldwide markets rode a wild roller-coaster this morning with global systemically important banking stocks crashing hard bringing back distant memories of what we saw in 2008. It appears that banks don’t have “fortress like balance sheets,” which increases the odds of more fallout to come.
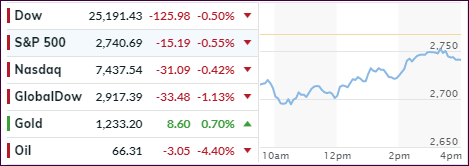
Global stock markets retreated in sync with the Dow getting hammered at the tune of 500 points with the Nasdaq and S&P 500 experiencing not only their own sharp declines, but also dipping below their respective 200-day M/As. However, as if by magic, most of the losses were made up during an afternoon levitation, which made the session look not as bad as it was. Makes me wonder how much of the sudden support came from the Plunge Protection Team (PPT) as opposed to dip buyers on the prowl.
Assisting in the early sell-off were earnings disappointments by 3M and Caterpillar (CAT) with the former not only missing Q3 earnings but also slashing guidance, while the latter warned about rising costs. Especially Cat’s chart is a picture of ugliness, even to the most casual observer and may very well set the tone for this earnings season.
Today’s session seems to confirm a change in sentiment and mindset, which some analysts referred to as “fade bounces,” “sell the rips” and “take down net exposure to new lows.” Others see the mantra changing from “growing faster than we are tightening” to “tightening ourselves in a slowdown.”
Even the much-hyped hope bounce of a one-day 4.1% in the Chinese Markets came to an end, and stocks resumed their wild ride to the downside. Asian shares in general dropped -2.1% to a 1.5 year low and are in danger of slipping into a bear market. Europe is facing a similar situation, as their tech sector just generated a “Death Cross” bearish signal.
I took the opportunity to liquidate our final position in “broadly diversified domestic equity ETFs,” as our Domestic TTI slipped deeper into bearish territory (see section 3). In my view, and judging by the above goings on, the odds of further downside moves have increased, especially if we start to catch down to the rest of the world. That’s why we will stand aside for the time being and establish new positions once our Domestic TTI crosses back above its trend line.
This is not the time to be a hero but to be more concerned with preservation of capital. If you were in the market during the 2008 disaster, then this reminder should ring a bell that history may not rhyme but has a funny way of repeating itself.
- ETFs in the Spotlight
In case you missed the announcement and description of this section, you can read it here again.
It features 10 broadly diversified and sector ETFs from my HighVolume list as posted every Saturday. Furthermore, they are screened for the lowest MaxDD% number meaning they have been showing better resistance to temporary sell offs than all others over the past year.
The below table simply demonstrates the magnitude with which some of the ETFs are fluctuating regarding their positions above or below their respective individual trend lines (%M/A). A break below, represented by a negative number, shows weakness, while a break above, represented by a positive percentage, shows strength.
For hundreds of ETF choices, be sure to reference Thursday’s StatSheet.
Year to date, here’s how our candidates have fared so far:
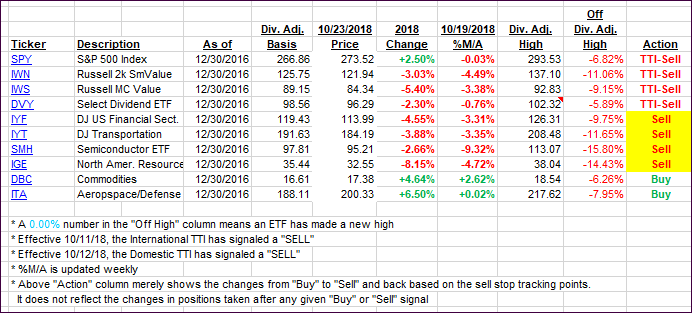
Again, the %M/A column above shows the position of the various ETFs in relation to their respective long-term trend lines, while the trailing sell stops are being tracked in the “Off High” column. The “Action” column will signal a “Sell” once the -8% point has been taken out in the “Off High” column. For more volatile sector ETFs, the trigger point is -10%.
- Trend Tracking Indexes (TTIs)
Our Trend Tracking Indexes (TTIs) dove again and are at this moment deeply entrenched on the bearish side of their respective trend lines.
Here’s how we closed 10/23/2018:
Domestic TTI: -2.73% below its M/A (last close -2.10%)—Sell signal effective 10/12/2018
International TTI: -4.92% below its M/A (last close -3.85%)—Sell signal effective 10/11/2018
Disclosure: I am obliged to inform you that I, as well as my advisory clients, own some of the ETFs listed in the above table. Furthermore, they do not represent a specific investment recommendation for you, they merely show which ETFs from the universe I track are falling within the guidelines specified.
Contact Ulli