Taking A Breather

Ulli Market Commentary Contact

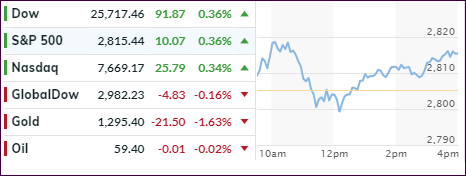
[Chart courtesy of MarketWatch.com]
  1. Moving the markets

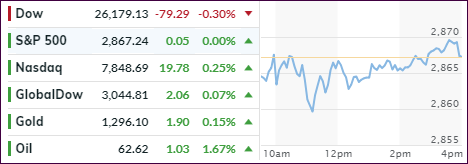
After rallying the past four trading days, it was time to take a breather with the major indexes traveling aimlessly around their respective trend lines. The S&P 500 closed unchanged, the Dow dropped -0.30%, while the Nasdaq managed to squeeze out +0.25%.

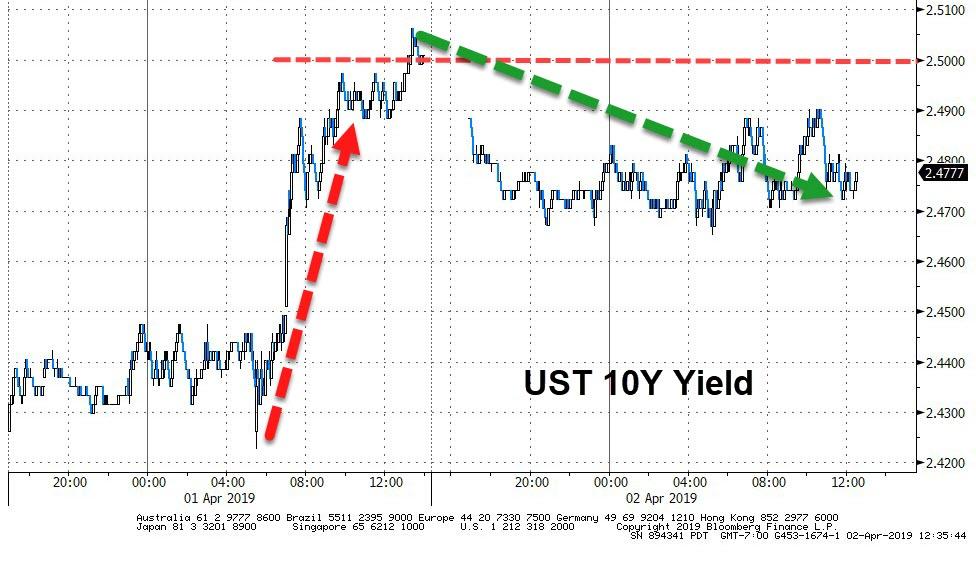
Bonds were on the mend with the 10-year yield dropping backing below 2.5% level to close at 2.472%. More importantly, the yield curve corrected and is no longer inverted, meaning that the 10-year bond now yields more than the 3-month one.

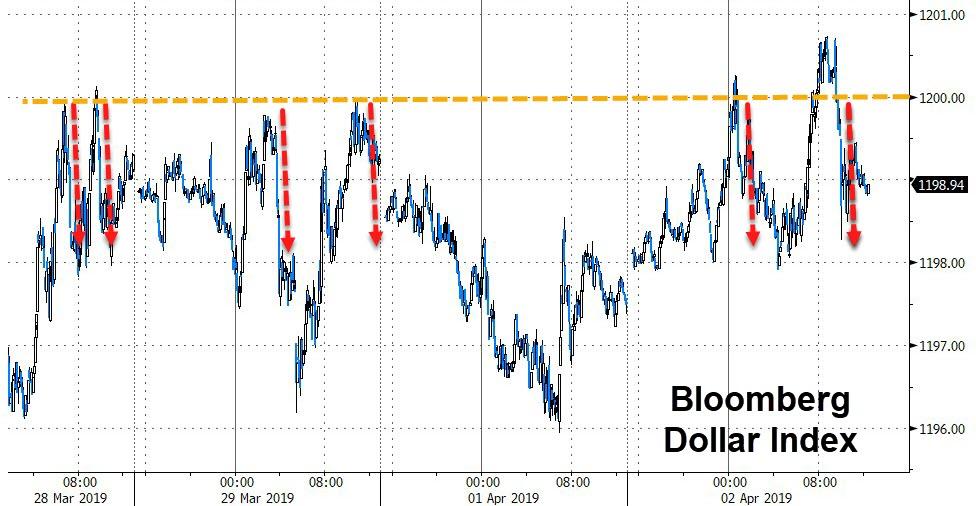
The U.S. Dollar index round-tripped, broke above the crucial 1,200 level twice but reversed to close lower. A day of consolidation best describes this session, which had not much effect on the direction of our Trend Tracking Indexes (TTIs).

Read More

Starting The 2nd Quarter With A Bang

Ulli Market Commentary Contact

[Chart courtesy of MarketWatch.com]
  1. Moving the markets

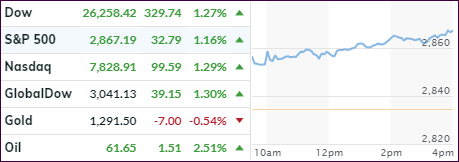
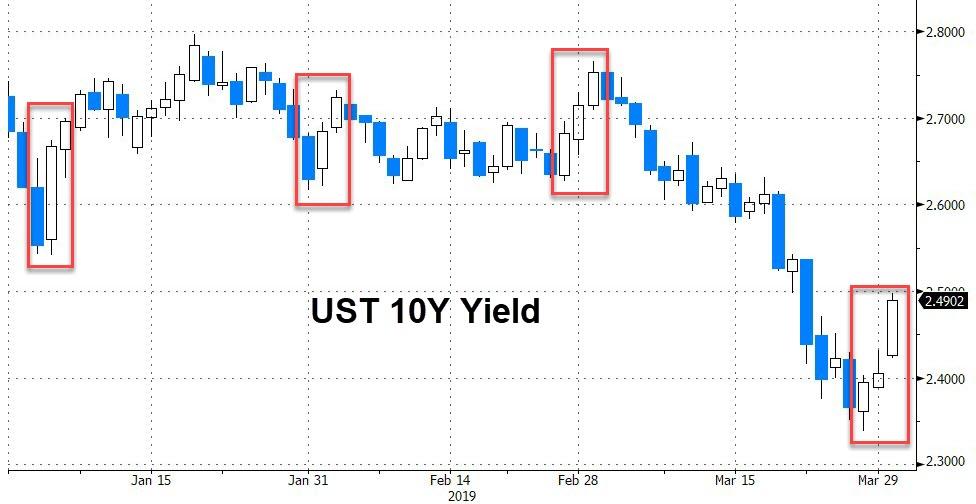
After closing out March on a positive note, April started with a bang, as the major indexes sported gains above 1%. The only fly in the ointment was a sharp spike in interest rates with the 10-bond shooting up almost 11 basis points to close at 2.5%, which kept the conservative ETFs in our portfolios lagging the indexes for the session.

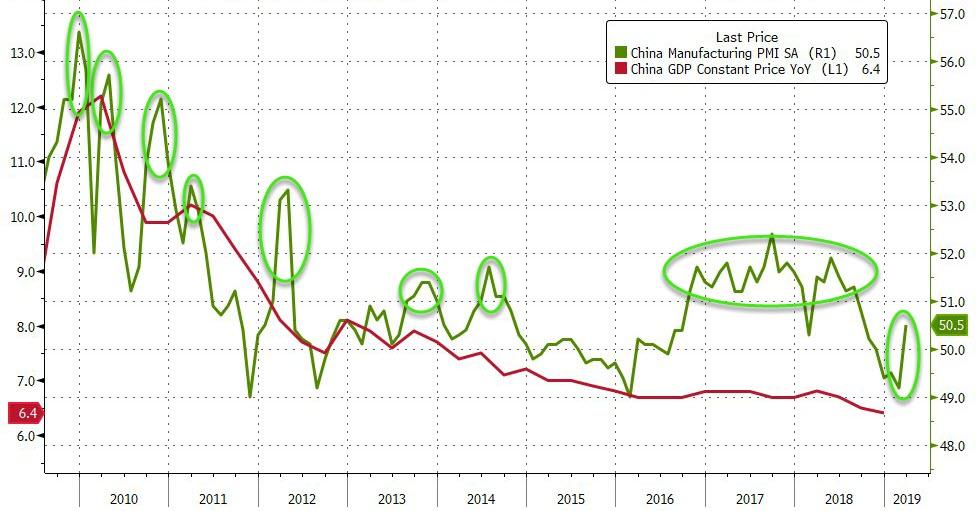
The rally was a global one supported by an allegedly improved PMI in China, which showed its first expansion in 5 months supporting the narrative that global headwinds are over and Chinese optimism is warranted and now has replaced the U.S.-China trade talk euphoria. We’ve seen these “green shoots” in the recent past, as ZH pointed out, and all ended up being of short duration.

Of course, traders conveniently forgot that the Chinese a long time ago announced that econ data are “for reference” only, which probably means that they are carefully “goal-seeked” and supported by political motivation.

On the other side of the globe, the eurozone’s manufacturing index continued to struggle and remains in contraction territory. Here in the U.S., retail sales figures disappointed as reports showed that the tapped-out consumer spent 0.2% less in February than in January, showing a trend towards thriftiness, which economists expect to affect economic growth numbers in the first quarter.

For status of our Trend Tracking Indexes (TTIs), this was good day with both of them jumping deeper into bullish territory (section 3).

Read More

ETFs On The Cutline – Updated Through 03/29/2019

Ulli ETFs on the Cutline Contact

Below, please find the latest High-Volume ETF Cutline report, which shows how far above or below their respective long-term trend lines (39-week SMA) my currently tracked ETFs are positioned.

This report covers the HV ETF Master List from Thursday’s StatSheet and includes 322 High Volume ETFs, defined as those with an average daily volume of more than $5 million, of which currently 236 (last week 208) are hovering in bullish territory. The yellow line separates those ETFs that are positioned above their trend line (%M/A) from those that have dropped below it.

Take a look:

The HV ETF Master Cutline Report

In case you are not familiar with some of the terminology used in the reports, please read the Glossary of Terms.

If you missed the original post about the Cutline approach, you can read it here.

ETF Tracker Newsletter For March 29, 2019

Ulli ETF Tracker Contact

ETF Tracker StatSheet

https://theetfbully.com/2019/03/weekly-statsheet-for-the-etf-tracker-newsletter-updated-through-03-28-2019/

ENDING THE QUARTER ON A POSITIVE NOTE
[Chart courtesy of MarketWatch.com]
  1. Moving the markets

Continued optimism about more progress with the U.S.-China trade talks moved to front and center thereby pushing concerns over slowing global economies to the sidelines, at least for the time being.

Supporting the early rally was the market debut of Uber competitor LYFT, whose shares ended up trading at a market premium of 20% of what they were priced Thursday evening.

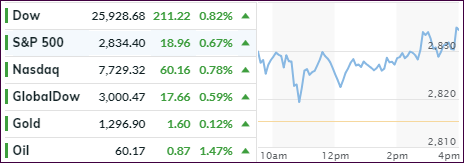
This bullish mood accelerated throughout the day with the major indexes picking up steam and closing at the highs of the day.

While the S&P 500 recorded its strongest quarter in a decade (+13.3%), let’s not forget that this comes after a devastating Q4 2018 performance of -13.5%, during which the Fed suddenly changed course by softening their interest rate policy thereby bailing out the Buy-and-Hold crowd and likely saving investors’ portfolios from far more serious destruction.

Ironically, all this occurred in the face of plunging bond yields and a surge in global money supply, while fundamental data, as represented by the Macro Surprise Index, simply tumbled.

But today, we also heard some positive econ reports during which we learned that consumer confidence rebounded and improved for the second straight month. At the same time, the pummeled real estate sector showed signs of life, as new home sales surged thanks to tumbling mortgage rates.

Earnings season will be on deck starting next week and will likely give us a better view not only if bullish forces are alive and well, but also if the markets have enough starch to weather out disappointments, which are sure to be part of the story line.

Read More

Weekly StatSheet For The ETF Tracker Newsletter – Updated Through 03/28/2019

Ulli ETF StatSheet Contact

ETF Data updated through Thursday, March 28, 2019

Methodology/Use of this StatSheet:

  1. From the universe of over 1,800 ETFs, I have selected only those with a trading volume of over $5 million per day (HV ETFs), so that liquidity and a small bid/ask spread are assured.
  2. Trend Tracking Indexes (TTIs)

Buy or Sell decisions for Domestic and International ETFs (section 1 and 2), are made based on the respective TTI and its position either above or below its long-term M/A (Moving Average). A crossing of the trend line from below accompanied by some staying power above constitutes a “Buy” signal. Conversely, a clear break below the line constitutes a “Sell” signal. Additionally, I use a 7.5% trailing stop loss on all positions in these categories to control downside risk.

  1. All other investment arenas do not have a TTI and should be traded based on the position of the individual ETF relative to its own respective trend line (%M/A). That’s why those signals are referred to as a “Selective Buy.” In other words, if an ETF crosses its own trendline to the upside, a “Buy” signal is generated. Since these areas tend to be more volatile, I recommend a wider trailing sell stop of 7.5% -10% depending on your risk tolerance.

If you are unfamiliar with some of the terminology, please see Glossary of Terms and new subscriber information in section 9.


  1. DOMESTIC EQUITY ETFs: BUY — since 02/13/2019

Click on chart to enlarge

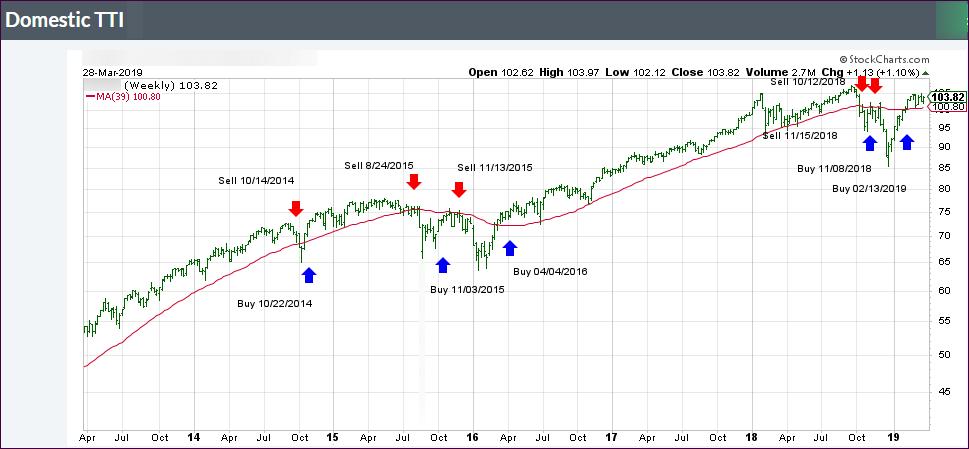
Our main directional indicator, the Domestic Trend Tracking Index (TTI-green line in the above chart) is now positioned above its long-term trend line (red) by +3.07% after having generated a new Domestic “Buy” signal effective 2/13/19 as posted.

Read More

Trade Hope Keeps The Bullish Theme Alive

Ulli Market Commentary Contact

[Chart courtesy of MarketWatch.com]
  1. Moving the markets

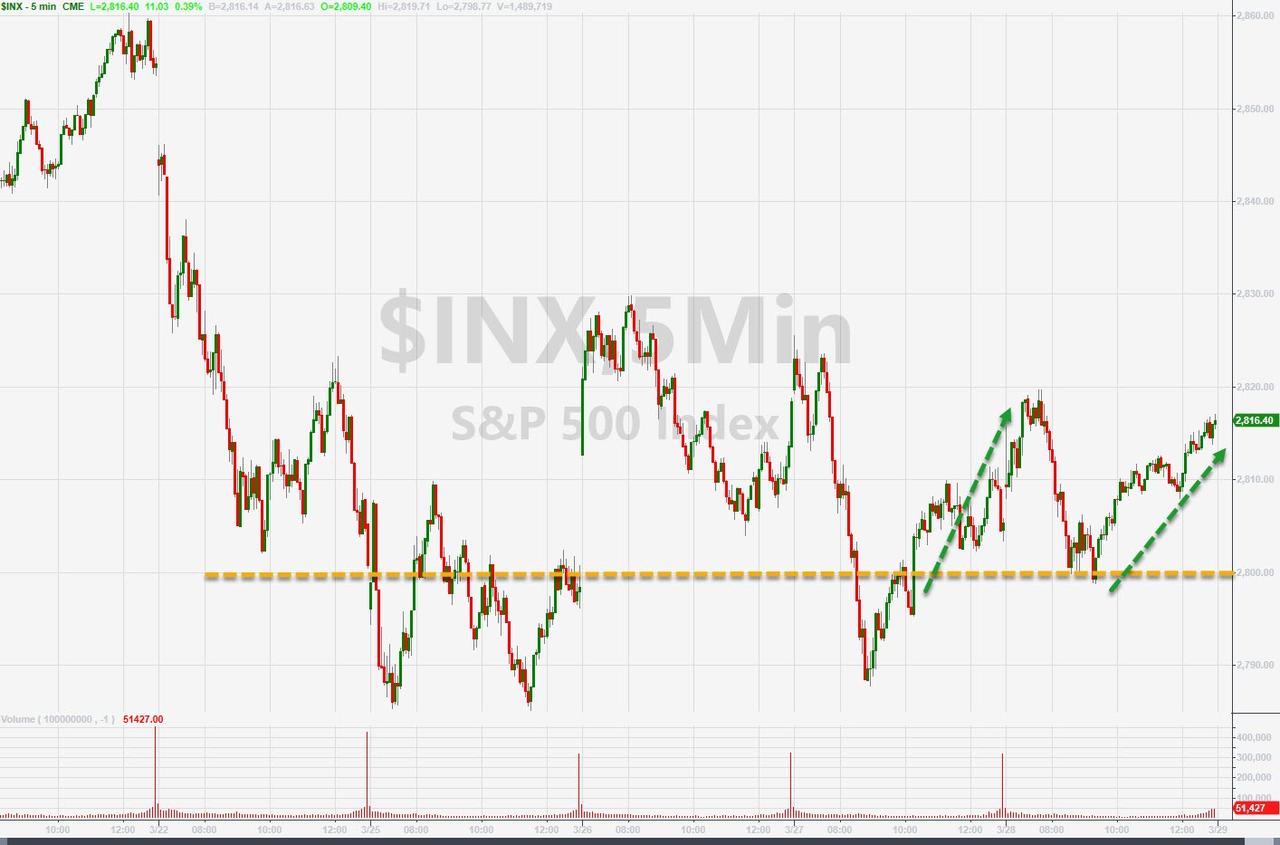
An early bounce gave way to selling with the S&P 500 touching its hard fought 2,800 level, before bullish sentiment prevailed and pulled all 3 major indexes out of the doldrums and into a green close.

Nevertheless, it was a choppy session with support coming from the dangling trade carrot which, on many occasions, has successfully supported and bailed out the bulls. Today was no different in that reports announced that “new progress toward a trade deal” had been made based on “unprecedented proposals” to resolve the long-running dispute.

Keeping the rebound in check was the revision that the U.S. economy grew at a slower 2.2% in Q4 2018 vs. the initial 2.6% estimate. However, even with this adjustment, GDP for all of 2018 came in at 2.9% matching 2015 for best performance since the Great Recession 10 years ago.

With bond yields having been clobbered, the beneficiary turned out to be mortgage rates with the 30-year now down to 4.37% on average vs. 4.54% in 2018. On the other hand, housing numbers have shown anything but greatness in that sector with the latest victim being pending home sales, which tumbled 4.9% YoY, their 14th straight month of declines.

We continue to be stuck in a sideways pattern, but I think we’ll see more clarity regarding the direction of the major trend once earnings season gets underway next week.

Read More