Corrective Bounce Off The Trend Lines

Ulli Market Commentary Contact

[Chart courtesy of MarketWatch.com]
  1. Moving the markets

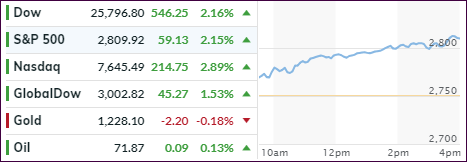
Forget yesterday’s ugly close, during which the major indexes got stuck below their respective 200-day M/As indicating more pain to come on the downside. Today was a new day, where the bulls ruled for the entire session, as an upbeat earnings mood and some decent economic data (US job openings, industrial production) wiped out any bearish concerns.

At least for this session, the widely watched 200-day M/As served as a springboard to pull the indexes (except SmallCaps) out of the doldrums and back into bullish territory. While one day does not make a trend, if there is more upside follow through, we may see a resumption of the bullish theme.

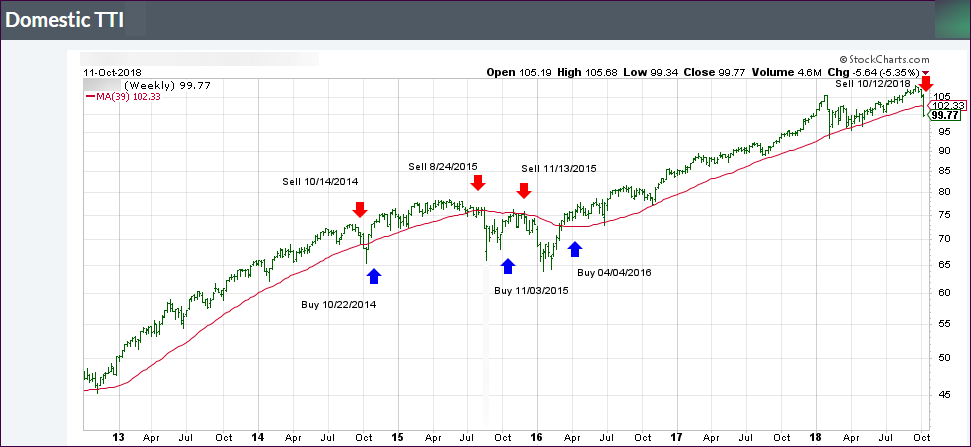
Let’s not forget that the S&P 500 had dropped sharply during last seven sessions and the Dow slipped heavily in the last four out of five, pushing our Trend Tracking Indexes (TTIs) into bear territory with the Domestic one closing below its trend line, however, without having had a chance to show any staying power. That fact prompted me to unload only a portion of our domestic holdings, while waiting for more downside confirmation.

If today is any indication, we may have experienced a whip-saw signal in the domestic arena assuming this was not a one-and-done event followed by a resumption of the recent slide and volatility. If there is some stability in the making, I will again increase our current exposure to the domestic market.

Of course, market manipulation is our constant companion and today’s assist came from the fact that today was the biggest short-squeeze day since November 2016’s post Trump election rebound, according to ZH. That violent ricochet feeds on itself as constantly rising prices force more shorts into covering their positions creating more and more buying power to propel the markets higher.

Still, for October, red remains the dominant color, and we’ll have to wait and see if this optimistic rebound has legs, with earning season just dead ahead, or will simply fade away.

Read More

Hovering In No-Man’s Land

Ulli Market Commentary Contact

[Chart courtesy of MarketWatch.com]
  1. Moving the markets

Traders were a nervous bunch today after the S&P 500 bounced off the lows last Friday and came to rest right on top of its 200-day M/A, which for many represents the dividing line between bullish and bearish territory.

Our Domestic Trend Tracking Index (TTI) already dipped below its own trend line last Thursday generating the signal to exit “broadly diversified domestic equity ETFs.” We eliminated most but are still holding some positions to not get caught in a whip-saw signal. These are slated to be sold as well as soon as I see more downside confirmation.

Today’s session did not offer much of a clue as to future market direction, since the major indexes clung to their respective unchanged lines. However, during the last 30 minutes, the bears appeared to have been unleashed (via Saudi headlines) and pushed the indexes clearly below the day’s trading range and the S&P 500 below its 200-day M/A where it closed for the 2nd time out of the past 3 days.

Looking at this S&P 500 chart, it appears that the bearish momentum has the upper hand for the time being.

Read More

ETFs On The Cutline – Updated Through 10/12/2018

Ulli ETFs on the Cutline Contact

Below, please find the latest High-Volume ETF Cutline report, which shows how far above or below their respective long-term trend lines (39-week SMA) my currently tracked ETFs are positioned.

This report covers the HV ETF Master List from Thursday’s StatSheet and includes 366 High Volume ETFs, defined as those with an average daily volume of more than $5 million, of which currently 60 (last week 152) are hovering in bullish territory. The yellow line separates those ETFs that are positioned above their trend line (%M/A) from those that have dropped below it.

Take a look:

The HV ETF Master Cutline Report

In case you are not familiar with some of the terminology used in the reports, please read the Glossary of Terms.

If you missed the original post about the Cutline approach, you can read it here.

ETF Tracker Newsletter For October 12, 2018

Ulli Market Commentary Contact

ETF Tracker StatSheet

https://theetfbully.com/2018/10/weekly-statsheet-for-the-etf-tracker-newsletter-updated-through-10-11-2018/

ENDING THE WEEK WITH PUMP, DUMP AND PUMP

[Chart courtesy of MarketWatch.com]
  1. Moving the markets

Today turned into another wild ride with the major indexes rebounding, then dropping, with the Dow turning negative after an early 400-point gain, after which buyers stepped in to pull equities out of the doldrums. In the end, we saw one of the worst weeks for stocks since March with the Dow surrendering -5.1%, while the S&P 500 and Nasdaq gave back -4.9% and -4.8% respectively.

That kind of week was enough to send both of our Trend Tracking Indexes (TTIs) into bear market territory and generating “Sell” signals as posted. The International one is stuck deeply on the bearish side of its trend line. The decline was broad based, as shown in Thursday’s StatSheet, where only red numbers can be seen in the International ETF section confirming my current stance to not be invested in that arena.

Domestically, as I posted yesterday, I liquidated the bulk of our positions. The remainder was scheduled for today, but I held off as I saw the rebound in the making. Nevertheless, our Domestic TTI remains in bear market territory with the Nasdaq being at the precipice of a correction, which is defined as a drop of 10% from recent highs.

Today’s earnings for the banking sector were mixed at best, leaving the Financials (XLF) in no man’s land as far as trend direction is concerned. It remains to be seen if the upcoming earnings season can provide enough ammunition to pull these markets out of the dumps.

Given the still lofty valuations, and the rise in corporate borrowing costs due to higher yields, it becomes questionable in my mind whether bull market momentum can be sustained. Again, it appears that the US markets are finally catching down to the rest of the world in regard to equity performance.

ZH simply called this month carnage when reviewing these stats:

  1. Nasdaq 100 is on course for the worst month since November 2008
  2. Small Caps are on course for the worst month since September 2011
  3. S&P is on course for the worst month since August 2015 (China Devaluation)

Looking at the big picture, we must consider the possibility that this bearish momentum could continue, of course, not in a straight line but interrupted by hopeful bounces. If so, we will liquidate our remaining holdings as this picture becomes clearer.

If, on the other hand, this rebound is strong enough to support the bulls, then we will add to our current holdings once our Domestic TTI has crossed its trend line to the upside again. At all times, we must keep our main goal in mind, which is avoiding participating in portfolio disasters like we saw in 2000 and 2008.

Read More

Weekly StatSheet For The ETF Tracker Newsletter – Updated Through 10/11/2018

Ulli ETF StatSheet Contact

ETF Data updated through Thursday, October 11, 2018


Methodology/Use of this StatSheet:

  1. From the universe of over 1,800 ETFs, I have selected only those with a trading volume of over $5 million per day (HV ETFs), so that liquidity and a small bid/ask spread are assured.
  2. Trend Tracking Indexes (TTIs)

Buy or Sell decisions for Domestic and International ETFs (section 1 and 2), are made based on the respective TTI and its position either above or below its long-term M/A (Moving Average). A crossing of the trend line from below accompanied by some staying power above constitutes a “Buy” signal. Conversely, a clear break below the line constitutes a “Sell” signal. Additionally, I use a 7.5% trailing stop loss on all positions in these categories to control downside risk.

  1. All other investment arenas do not have a TTI and should be traded based on the position of the individual ETF relative to its own respective trend line (%M/A). That’s why those signals are referred to as a “Selective Buy.” In other words, if an ETF crosses its own trend-line to the upside, a “Buy” signal is generated. Since these areas tend to be more volatile, I recommend a wider trailing sell stop of 7.5% -10% depending on your risk tolerance.

If you are unfamiliar with some of the terminology, please see Glossary of Terms and new subscriber information in section 9.


  1. DOMESTIC EQUITY ETFs: SELL — since 10/12/2018

Click on chart to enlarge

Our main directional indicator, the Domestic Trend Tracking Index (TTI-green line in the above chart) is now positioned below its long-term trend line (red) by -2.59% after having generated a new Domestic “Sell” signal effective 10/12/18 as posted.

Read More

Battling For A Comeback—And Failing—Domestic TTI Confirms “Sell” Signal

Ulli Market Commentary Contact

[Chart courtesy of MarketWatch.com]
  1. Moving the markets

A meager attempt of an early bounce was rebuffed, and the major indexes continued to head south towards bear market territory. I pondered yesterday whether the sell-off was overdone and might produce a quick rebound, or whether we were heading much lower and ending this bullish cycle.

The latter transpired as bouts of selling were interrupted by hopeful bounces, but the bears did not let up, and we dove into the close, just a tad off the session’s low point, as the chart above shows.

It was not just the US showing red numbers. Europe got hammered while the Asia indexes got crushed losing more than -3%, as China took the downside lead with -5.22%. Adding insult to injury was the fact that trading in some 1,000 Chinese companies was halted due to them hitting the 10% limit down rule. Ouch!

All of this is not surprising, as our International TTI already had crossed into bear market territory with the Domestic one now joining in. See section 3 below for more details.

In my advisor practice, I took the opportunity to liquidate most of our holdings, with the remainder being scheduled for tomorrow, unless I see a sharp rebound in the making. In that case, I will hold off for another day.

The ‘red’ October has clearly exacted a heavy toll with Transportations, Nasdaq and SmallCaps being down 9%—in only 9 trading days! The S&P has its own problem by not only being down for the 6th straight day in a row, but it has also sliced through its 200-day M/A for the first time since April.

Clearly, most technical indicators have been violated for most of the major indexes as well as for most of the sector ETFs. Some are now showing negative returns YTD, while for others, gains are quickly evaporating.

Interest rates eased a tad with the 10-year bond yield sliding 2.6 basis points to close at 3.14%. Consequently, the 20-year bond ETF (TLT) managed to close +1.22%, finally throwing an assist to those investors who hold TLT as a “risk” manager in their portfolios.

Does this mean that US markets are finally accepting reality by syncing up with the rest of the world? This chart seems to confirm that possibility, but if so, there is a long way to go.

The action of the past 2 days confirms the adage that “markets take the escalator up and the elevator down.” So, it’s quite possible that we will see a recovery, maybe by the end of this month that, after the mid-term elections, may very well accelerate and boost the S&P 500 to the 3,000 level by year-end as this fund manager seems to think.

Of course, before that happens, our Domestic TTI will have signaled a new “Buy,” which will let us participate in this year-end rally, should it materialize.

Read More