
ETF Tracker StatSheet
ENDING THE WEEK WITH PUMP, DUMP AND PUMP
- Moving the markets
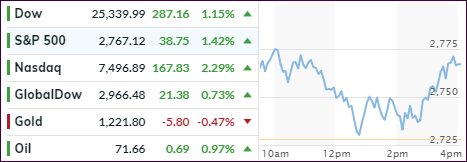
Today turned into another wild ride with the major indexes rebounding, then dropping, with the Dow turning negative after an early 400-point gain, after which buyers stepped in to pull equities out of the doldrums. In the end, we saw one of the worst weeks for stocks since March with the Dow surrendering -5.1%, while the S&P 500 and Nasdaq gave back -4.9% and -4.8% respectively.
That kind of week was enough to send both of our Trend Tracking Indexes (TTIs) into bear market territory and generating “Sell” signals as posted. The International one is stuck deeply on the bearish side of its trend line. The decline was broad based, as shown in Thursday’s StatSheet, where only red numbers can be seen in the International ETF section confirming my current stance to not be invested in that arena.
Domestically, as I posted yesterday, I liquidated the bulk of our positions. The remainder was scheduled for today, but I held off as I saw the rebound in the making. Nevertheless, our Domestic TTI remains in bear market territory with the Nasdaq being at the precipice of a correction, which is defined as a drop of 10% from recent highs.
Today’s earnings for the banking sector were mixed at best, leaving the Financials (XLF) in no man’s land as far as trend direction is concerned. It remains to be seen if the upcoming earnings season can provide enough ammunition to pull these markets out of the dumps.
Given the still lofty valuations, and the rise in corporate borrowing costs due to higher yields, it becomes questionable in my mind whether bull market momentum can be sustained. Again, it appears that the US markets are finally catching down to the rest of the world in regard to equity performance.
ZH simply called this month carnage when reviewing these stats:
- Nasdaq 100 is on course for the worst month since November 2008
- Small Caps are on course for the worst month since September 2011
- S&P is on course for the worst month since August 2015 (China Devaluation)
Looking at the big picture, we must consider the possibility that this bearish momentum could continue, of course, not in a straight line but interrupted by hopeful bounces. If so, we will liquidate our remaining holdings as this picture becomes clearer.
If, on the other hand, this rebound is strong enough to support the bulls, then we will add to our current holdings once our Domestic TTI has crossed its trend line to the upside again. At all times, we must keep our main goal in mind, which is avoiding participating in portfolio disasters like we saw in 2000 and 2008.
- ETFs in the Spotlight
In case you missed the announcement and description of this section, you can read it here again.
It features 10 broadly diversified and sector ETFs from my HighVolume list as posted every Saturday. Furthermore, they are screened for the lowest MaxDD% number meaning they have been showing better resistance to temporary sell offs than all others over the past year.
The below table simply demonstrates the magnitude with which some of the ETFs are fluctuating regarding their positions above or below their respective individual trend lines (%M/A). A break below, represented by a negative number, shows weakness, while a break above, represented by a positive percentage, shows strength.
For hundreds of ETF choices, be sure to reference Thursday’s StatSheet.
Year to date, here’s how our candidates have fared so far:
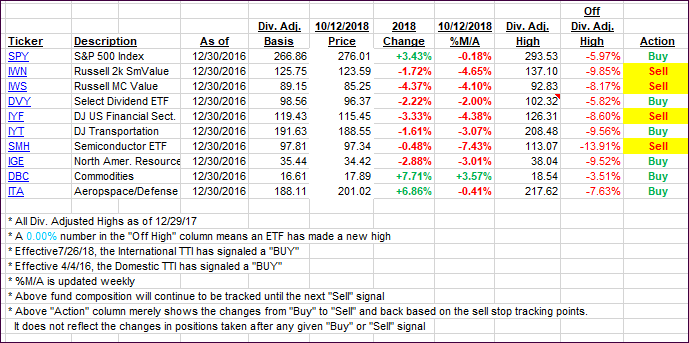
Again, the %M/A column above shows the position of the various ETFs in relation to their respective long-term trend lines, while the trailing sell stops are being tracked in the “Off High” column. The “Action” column will signal a “Sell” once the -8% point has been taken out in the “Off High” column. For more volatile sector ETFs, the trigger point is -10%.
- Trend Tracking Indexes (TTIs)
Our Trend Tracking Indexes (TTIs) recovered as the markets see-sawed but closed higher
Here’s how we closed 10/12/2018:
Domestic TTI: -1.53% below its M/A (last close -2.59%)—Sell signal effective 10/12/2018
International TTI: -3.56% below its M/A (last close -4.37%)—Sell signal effective 10/11/2018
Disclosure: I am obliged to inform you that I, as well as my advisory clients, own some of the ETFs listed in the above table. Furthermore, they do not represent a specific investment recommendation for you, they merely show which ETFs from the universe I track are falling within the guidelines specified.
————————————————————-
READER Q & As
All Reader Q & A’s are listed at our web site!
Check it out at:
https://theetfbully.com/questions-answers/
———————————————————-
WOULD YOU LIKE TO HAVE YOUR INVESTMENTS PROFESSIONALLY MANAGED?
Do you have the time to follow our investment plans yourself? If you are a busy professional who would like to have his portfolio managed using our methodology, please contact me directly or get more details at:
https://theetfbully.com/personal-investment-management/
———————————————————
Back issues of the ETF/No Load Fund Tracker are available on the web at:
https://theetfbully.com/newsletter-archives/
Contact Ulli