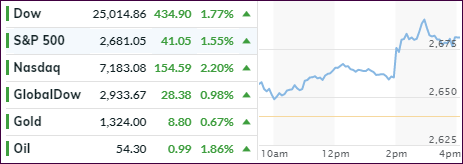
[Chart courtesy of MarketWatch.com]
- Moving the markets
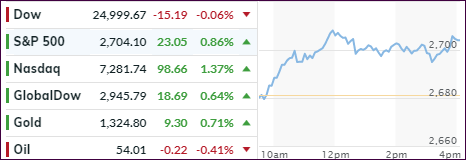
The markets jumped right after the opening bell powered by Boeing’s earnings and better-than-expected results from Apple and Advanced Micro Devices (AMD). However, to put this in proper perspective, only 3 stocks (Boeing, Apple, McDonald’s) are accounting for 250 points in the Dow’s advance.
It’s not that the technology darlings showed a superior report card, no, it was a sigh of relief rally that the outcomes weren’t as bad as had been anticipated. After all, Apple saw not only a decline in revenue during the Holiday quarter but also a reduced sales outlook for the current period.
Also helping the bullish mood was ADP’s January jobs report noting that 213k jobs were added in January vs. 181k expected. This number by itself can give us a sense as to what the government employment report due out Friday is likely to show, although these 2 reports do not always move in sync over time.
Then it was the Fed’s turn to shine, which was akin to surrendering to the markets with this statement:
“In light of global economic and financial developments and muted inflation pressures, the Committee will be patient as it determines what future adjustments to the target range for the federal funds rate may be appropriate to support these outcomes.”
According to Goldman Sachs, there are some of big changes, that popped up unexpectedly:
The FOMC adds “patient” rate outlook amid muted inflation and global developments and introduces flexibility in balance-sheet normalization.
The Fed removes a statement about “some further gradual increases.”
The line about “balance of risks” is also removed, replaced by a line about policy “patience amid muted inflation and global economic and financial developments.”
However, the surprise came when the Fed subsequently revealed this bon mot:
The committee is prepared to adjust any of the details for completing balance sheet normalization in light of economic and financial developments.
Wow! What a turnaround from the hawkish viewpoints expressed in December by Fed head Powell. The simple translation: We will accommodate the markets in whatever form we can by not hiking rates as planned and stopping our balance sheet reduction, if necessary.
In other words, it looks like the -14% 4th quarter 2018 loss in the S&P 500 caused the Fed to get cold feet and reverse course. For us trend followers it means that the likelihood of the bear market coming to an end just increased, and a new bull market may be on deck and begin soon.
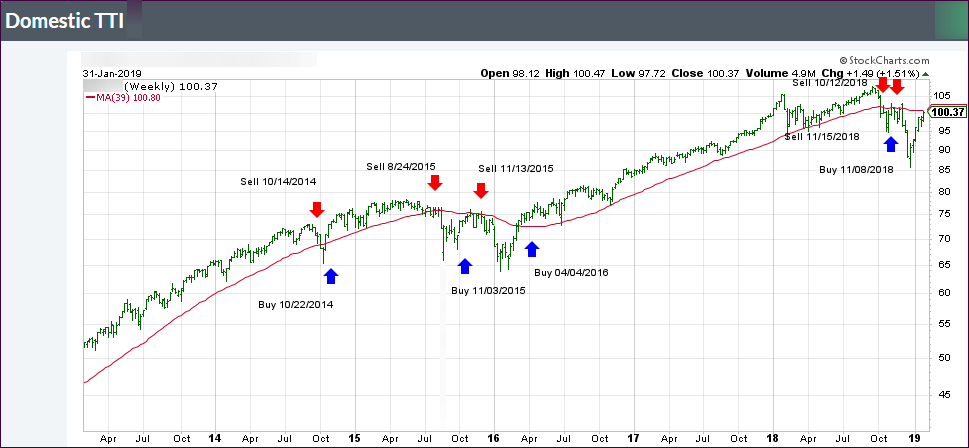
Our Domestic Trend Tracking Index (TTI) confirms this view as it is currently positioned only -1.06% away from breaking its trend line to the upside and generating a new ‘Buy’ signal.
Read More
