
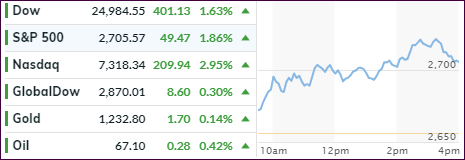
- Moving the markets
Having been involved in the investment methodology of trend tracking for the past 30 years, I have seen my share of violent market swings in both directions. I was reminded of that when, after yesterday’s 600-point drubbing of the Dow, today’s rebound, or was it a dead-cat-bounce, recovered about 400 points.
These kinds of jaw dropping sell-offs followed by impressive comebacks are typical of the swings you see when we drop into bearish territory, as defined by my Trend Tracking Indexes (TTIs), which have been hovering below their respective trend lines since last week.
Once we are “below” the line, it does not mean that this correction will turn into a full-fledged bear market, it could simply be an overreaction to negative news. However, at that point the odds are increased that more downside activity could be in the cards as conflicting factors and uncertainty favor the bearish crowd.
On the other hand, bull markets have found new life when things looked bad and sellers had run out of ammunition. Today’s rebound is totally inconclusive as to which directional path the markets will take. Using our trend tracking methodology, we will let the markets tell us when it’s time to act.
Should this rebound have legs and generate more upward momentum, we will see an eventual crossing of our TTIs (section 3) back into bullish territory, which will then generate a new “Buy” signal for the affected asset classes. Right now, however, the bears have the upper hand, and we will wait and observe this tug-of-war, which is sure to continue until a directional breakout will clarify the current murky picture.
- ETFs in the Spotlight
In case you missed the announcement and description of this section, you can read it here again.
It features 10 broadly diversified and sector ETFs from my HighVolume list as posted every Saturday. Furthermore, they are screened for the lowest MaxDD% number meaning they have been showing better resistance to temporary sell offs than all others over the past year.
The below table simply demonstrates the magnitude with which some of the ETFs are fluctuating regarding their positions above or below their respective individual trend lines (%M/A). A break below, represented by a negative number, shows weakness, while a break above, represented by a positive percentage, shows strength.
For hundreds of ETF choices, be sure to reference Thursday’s StatSheet.
Year to date, here’s how our candidates have fared so far:
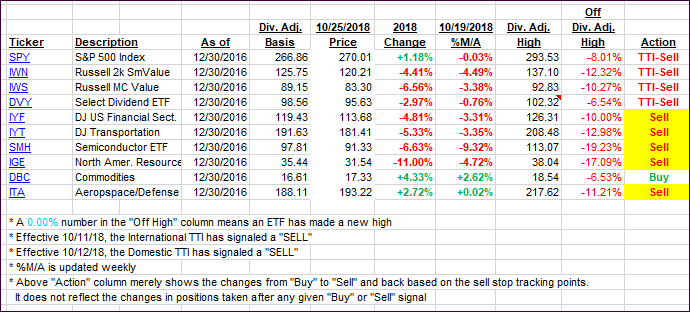
Again, the %M/A column above shows the position of the various ETFs in relation to their respective long-term trend lines, while the trailing sell stops are being tracked in the “Off High” column. The “Action” column will signal a “Sell” once the -8% point has been taken out in the “Off High” column. For more volatile sector ETFs, the trigger point is -10%.
- Trend Tracking Indexes (TTIs)
Our Trend Tracking Indexes (TTIs) recovered with the Domestic one showing more strength.
Here’s how we closed 10/25/2018:
Domestic TTI: -4.07% below its M/A (last close -5.31%)—Sell signal effective 10/12/2018
International TTI: -6.48% below its M/A (last close -6.76%)—Sell signal effective 10/11/2018
Disclosure: I am obliged to inform you that I, as well as my advisory clients, own some of the ETFs listed in the above table. Furthermore, they do not represent a specific investment recommendation for you, they merely show which ETFs from the universe I track are falling within the guidelines specified.
Contact Ulli