Below, please find the latest High-Volume ETF Cutline
report, which shows how far above or below their respective long-term trend
lines (39-week SMA) my currently tracked ETFs are positioned.
This report covers the HV ETF Master List from Thursday’s
StatSheet and includes 322 High Volume ETFs, defined as those with an average
daily volume of more than $5 million, of which currently 278 (last week 279)
are hovering in bullish territory. The yellow line separates those ETFs that
are positioned above their trend line (%M/A) from those that have dropped below
it.
In case you are not familiar
with some of the terminology used in the reports, please read the Glossary of Terms.
If you missed the original
post about the Cutline approach, you can read it here.
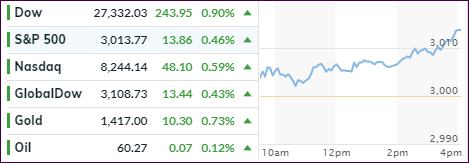
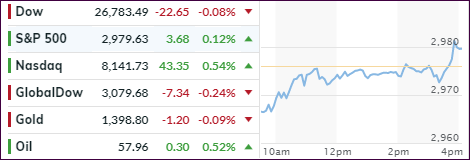
Yesterday’s rally continued this morning and accelerated
throughout the session, as traders were now convinced that a rate cut by the
Fed is a sure thing, so front running was the name of the game.
Since Fed chair Powell’s 2-day congressional testimony
did not include any negatives, but rather words like the U.S. economy is in a “very
good place,” traders felt invigorated that a cut was coming, so the bullish
theme continued.
Even a stronger-than-expected U.S. inflation
print in core producer
prices could not put a dent in current enthusiasm, with further support
coming from hopes the global economy will slow even more, forcing the Fed’s
hand for a possible 0.5% reduction in rates.
One analyst summed it up like this:
This is one of those mornings where bad news
is good news for stocks, while good news is bad news for bonds… or in other
words, any news is good for stocks.
The bullish view did not carry through all investment
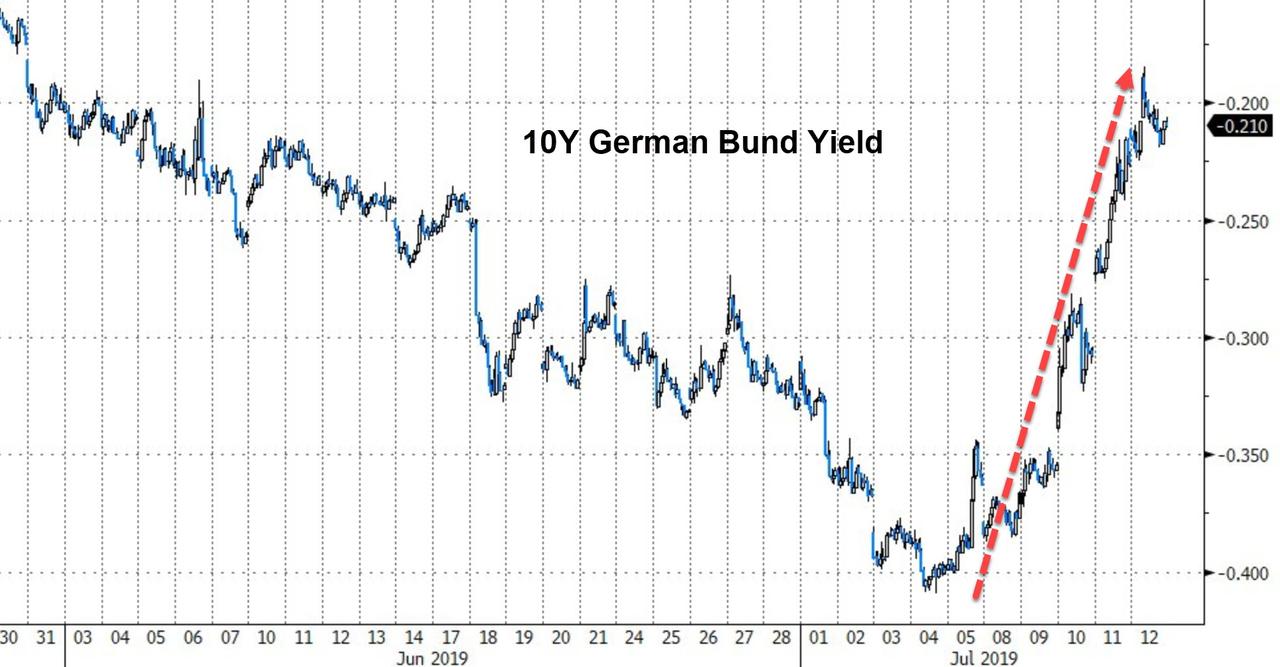
arenas. Chinese, European and Small Caps all lost for the week. Bond yields
suffered, especially in Germany where the 10-year spiked
the most since the middle of 2017, as prices collapsed.
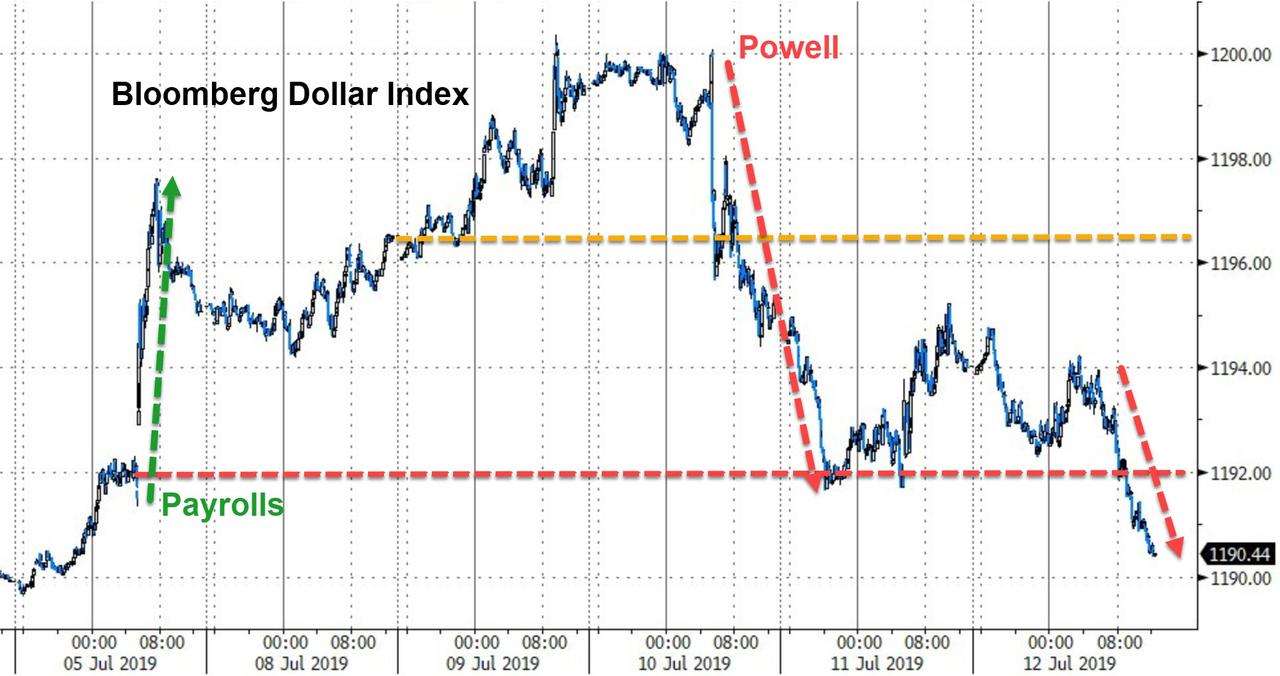
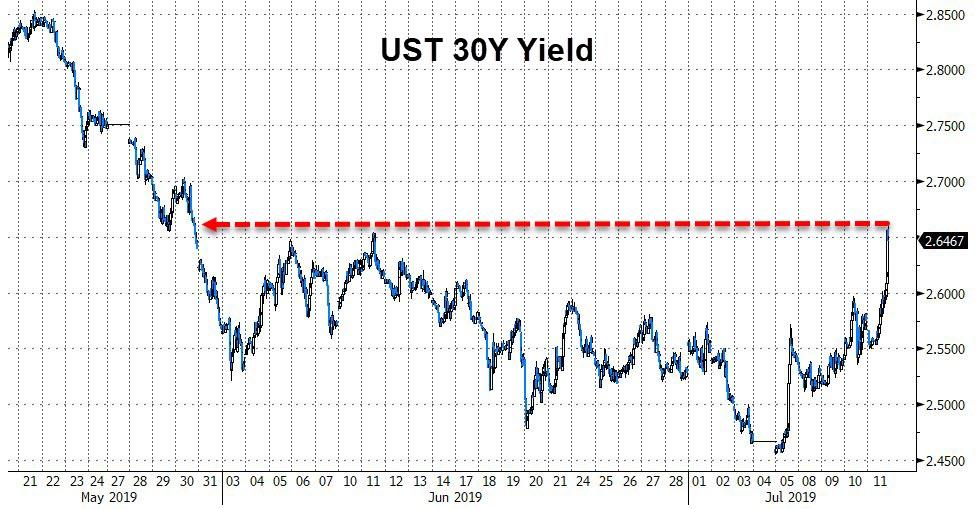
Same here in the U.S. with specifically the 30-year
yield jumping to 7-week highs, as the dollar
corrected back down after its surge following the payroll announcement.
Things appear very uncertain and confusing, when
looking at the big picture, which led BofA to release the following statement:
“…we anticipate an
“overshoot” in credit & equity prices in coming months, followed
by an overshoot in gold (US$ devaluation) before big H2 top in asset prices (as
bond bubble pops & policy impotence visible).”
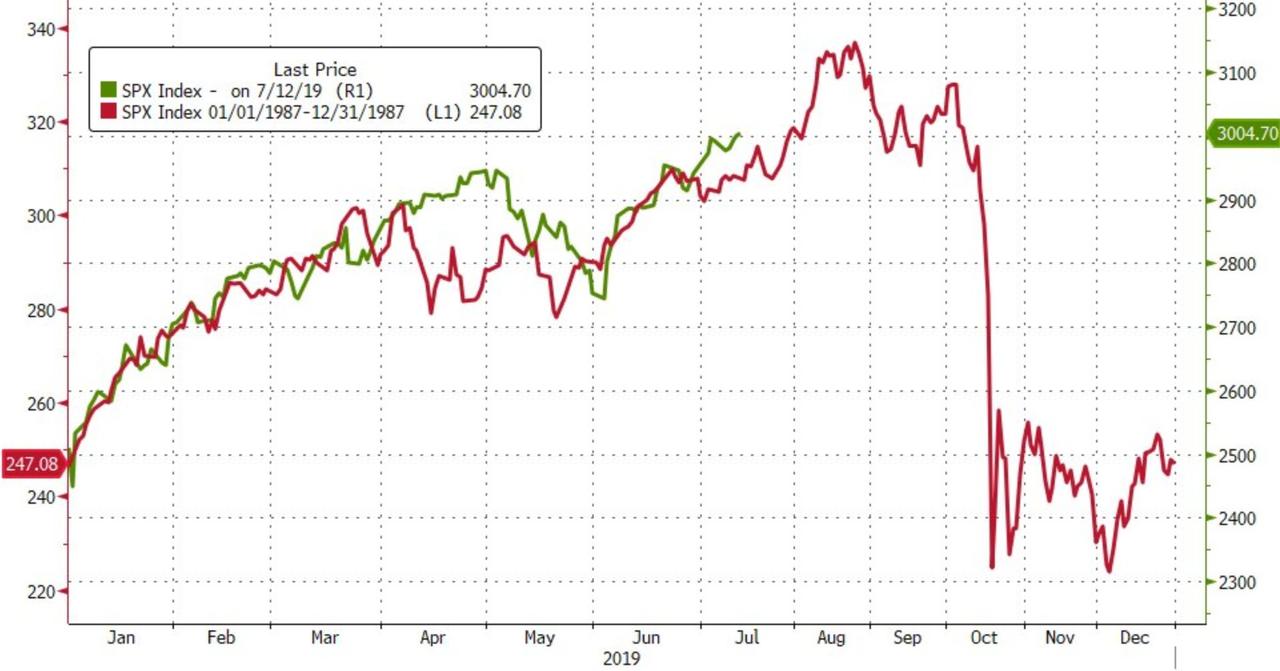
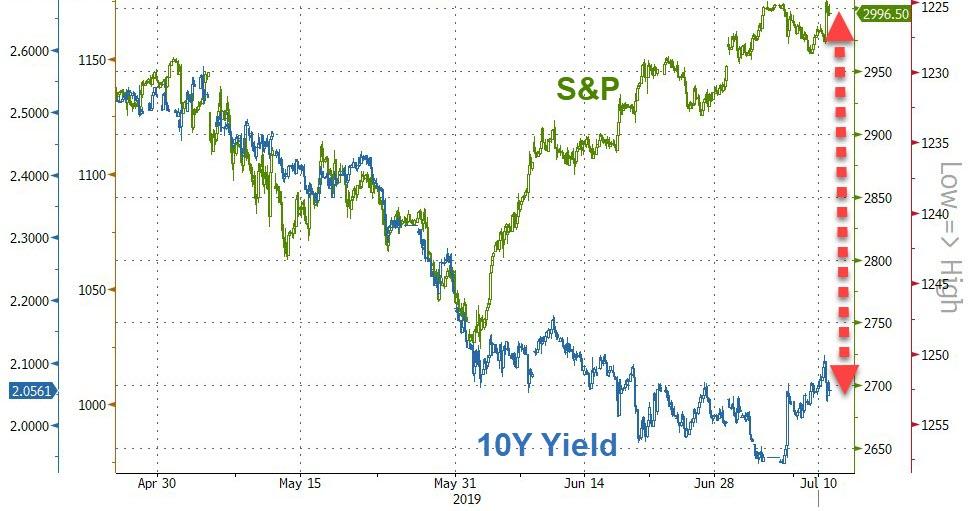
That prompted ZeroHedge to update this
chart, which suggests that a picture is worth a thousand words.
1. From the universe of over 1,800 ETFs, I have selected only those with a
trading volume of over $5 million per day (HV ETFs), so that liquidity and a
small bid/ask spread are assured.
2. Trend Tracking Indexes (TTIs)
Buy or Sell decisions for Domestic and International ETFs (section 1 and
2), are made based on the respective TTI and its position either above or below
its long-term M/A (Moving Average). A crossing of the trend line from below
accompanied by some staying power above constitutes a “Buy” signal. Conversely,
a clear break below the line constitutes a “Sell” signal. Additionally, I use a
7.5% trailing stop loss on all positions in these categories to control
downside risk.
3. All other investment arenas do not have a TTI and should be traded
based on the position of the individual
ETF relative to its own respective trend line (%M/A). That’s why those signals
are referred to as a “Selective Buy.” In other words, if an ETF crosses its own
trendline to the upside, a “Buy” signal is generated. Since these areas tend to
be more volatile, I recommend a wider trailing sell stop of 7.5% -10% depending
on your risk tolerance.
If you are unfamiliar with some of the terminology, please see Glossary of Termsand new subscriber information in section 9.
1. DOMESTIC EQUITY ETFs: BUY
— since 02/13/2019
Click on chart to enlarge
Our main directional indicator, the Domestic Trend Tracking Index (TTI-green line in the above chart) is now positioned above its long-term trend line (red) by +7.78% after having generated a new Domestic “Buy” signal effective 2/13/19 as posted.
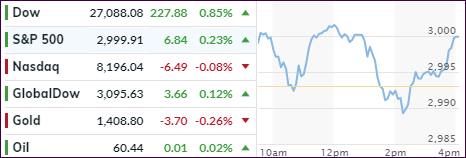
While the Dow managed to
conquer its new milestone marker of 27,000 with relative ease, and close above
it, the S&P 500 struggled with its record 3,000 level. It managed to trade
above it for a brief period but fell just short of defeating that hurdle by
ending the day at 2,999.91.
It was another day of trading
in a wide range, as an early rally lost steam with equities taking a sudden
dive towards the unchanged line after Trump tweeted his dissatisfaction with
China’s efforts about the trade truce.
Market disappointment was
short lived with the rally resuming only to lose steam again with the indexes summersaulting
but this time below the unchanged line. This was due to a poor bond auction, as
the 30-year yield exploded to 6-week
highs. However, as if by magic, the third attempt to take out the old highs
was accompanied by some staying power with only the Nasdaq ending slightly in
the red.
Some pain for Fed head Powell’s
dovish ideas arrived in form of a hotter than expected core inflation rate, which
rose 0.3% from the prior month to 2.1%, which is not just the most since
January 2018 but also above the Fed’s 2% target.
How does a higher inflation
rate compute with the intention of lowering interest rates? Not very well, in
my opinion. The Fed will have some hard decisions to make when it meets later this
month.
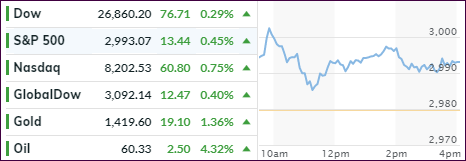
The markets opened higher,
pulled back but maintained its presence safely above the unchanged line. The
S&P 500 succeeded in briefly crawling above its 3,000-milestone marker,
retreated in a hurry but managed to close in the green, as did the other 2 major
indexes. The Nasdaq fared the best by sporting a +0.75% gain.
All eyes were on Fed chief
Powell, who acknowledged that the U.S. “is suffering from a bout of
uncertainty caused by trade tensions and weak global growth,” but he promised
to “do whatever it takes” to prop up the economy. Of course, traders took
that as a sign that lower interest rates are on deck, which helped the bullish
cause for the day.
The Fed illuminated things
even further by stating that they will “act as appropriate to sustain the
expansion,” which lent further support to those hoping for a rate cut. Powell
also kept repeatedly emphasizing the effect of trade tensions and a slower growth
around the world.
Again, the entire scenario
appears to be backwards to me. Here we have the S&P 500 hugging the 3,000-milestone,
yet Powell indicates that rate cuts are on the horizon. To be clear, rate cuts
are usually implemented to support a sagging economy and not pump up markets.
On the other hand, it could very
well be that, as I posted before, the economy is in such bad shape that lower
rates are required to keep it alive, yet the stock market (the ‘dumb’ money as opposed
the bond market representing the ‘smart’ money), is as usual the last one to get
the message.
An early slide managed to gain
some traction, followed by a small rebound that had the S&P 500 hugging its
unchanged line throughout most of the session, before a last-minute pump pushed
the index into the green by a tiny margin.
The outlook for interest
rate reductions later this month has become clouded, thanks to last week’s stronger
than expected June jobs report, but Wall Street traders still are clinging to hope
that a 0.25% cut will materialize.
While the whisper number was
a 0.5% reduction, which had been largely priced in, it makes anything less question
traders as to the success of such an effort. Remember, Wall Street is spoiled
and addicted to lower rates, without which a continuation of the bull market
becomes questionable. We saw the result of a disappointing Fed by the market reaction
last year.
In the end, the markets did
nothing and may not move much in either direction until the Fed clarifies its
policy. With this having been a relatively quiet day, ZH decided to post the
current S&P performance when overlaid
on the 1987 market debacle.